Creating a Scatter Plot
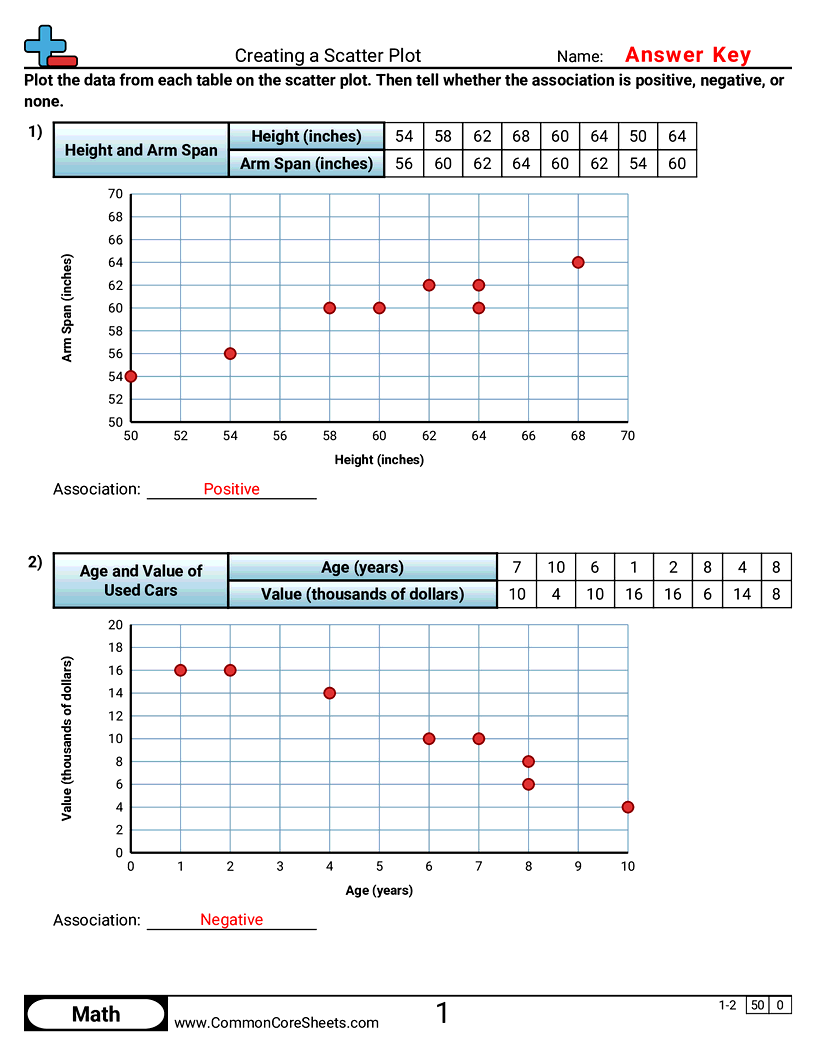
Students plot eight pairs of data from a table on a blank scatter plot, then decide whether the association is positive, negative, or none.


Student Objectives
- Plot pairs of data from a table on a scatter plot
- Read a scale that does not count by ones
- Decide whether a scatter plot shows a positive, negative or no association
Standards
