Reading a Scatter Plot
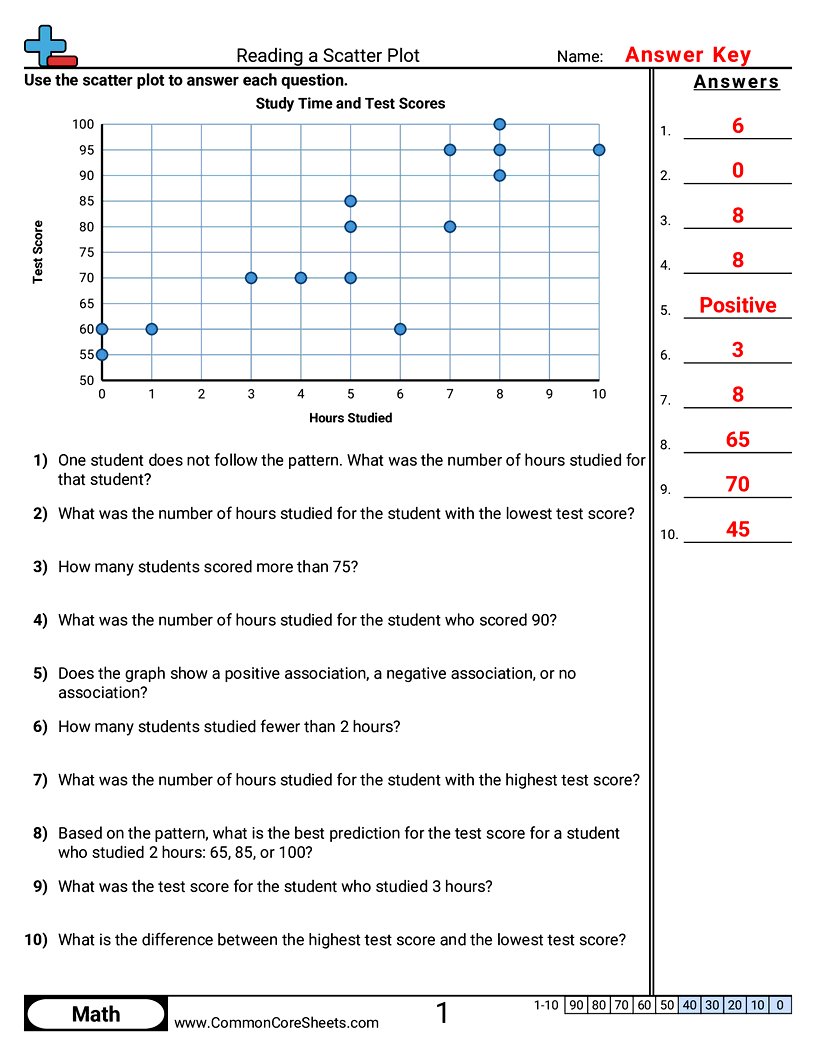
One scatter plot is shown at the top of the sheet and ten questions below it ask students to read points, count data above or below a value, find the outlier, name the association and predict from the trend.


Student Objectives
- Read the value of a point on a scatter plot
- Count data points above, below or between values
- Find the outlier that does not follow the pattern
- Describe the association as positive, negative or none
- Use the trend to make a prediction
Standards
