Graphing Probability Worksheets
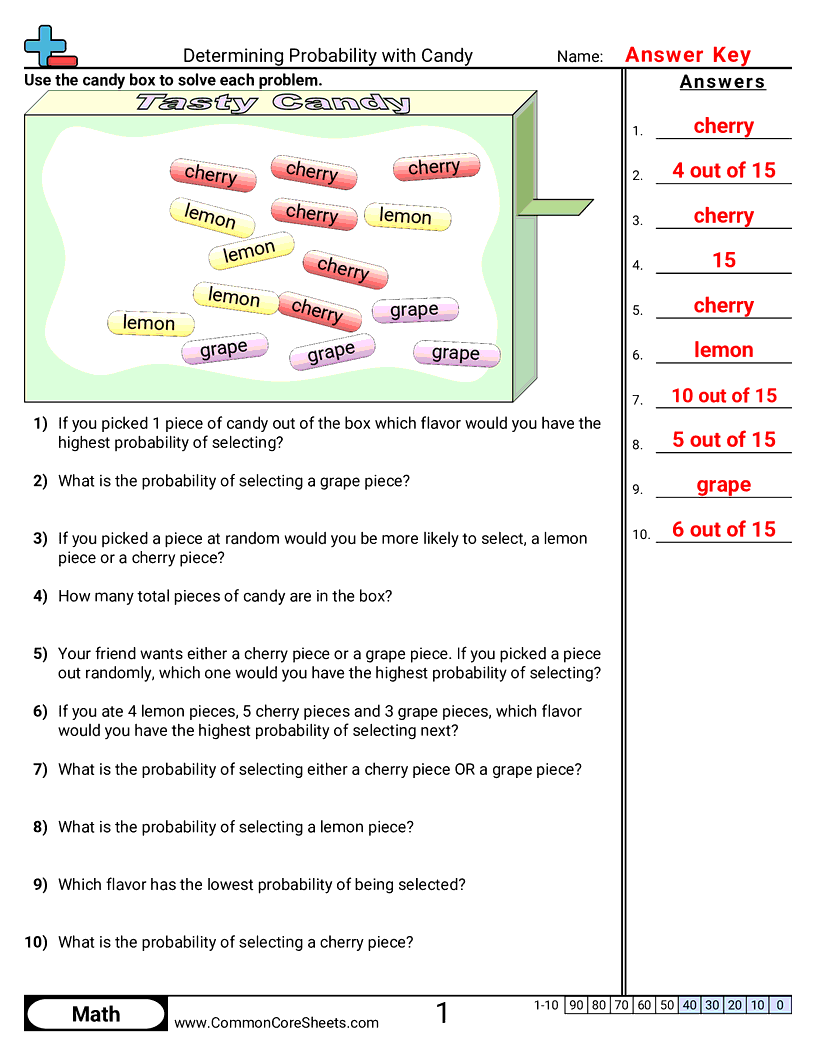
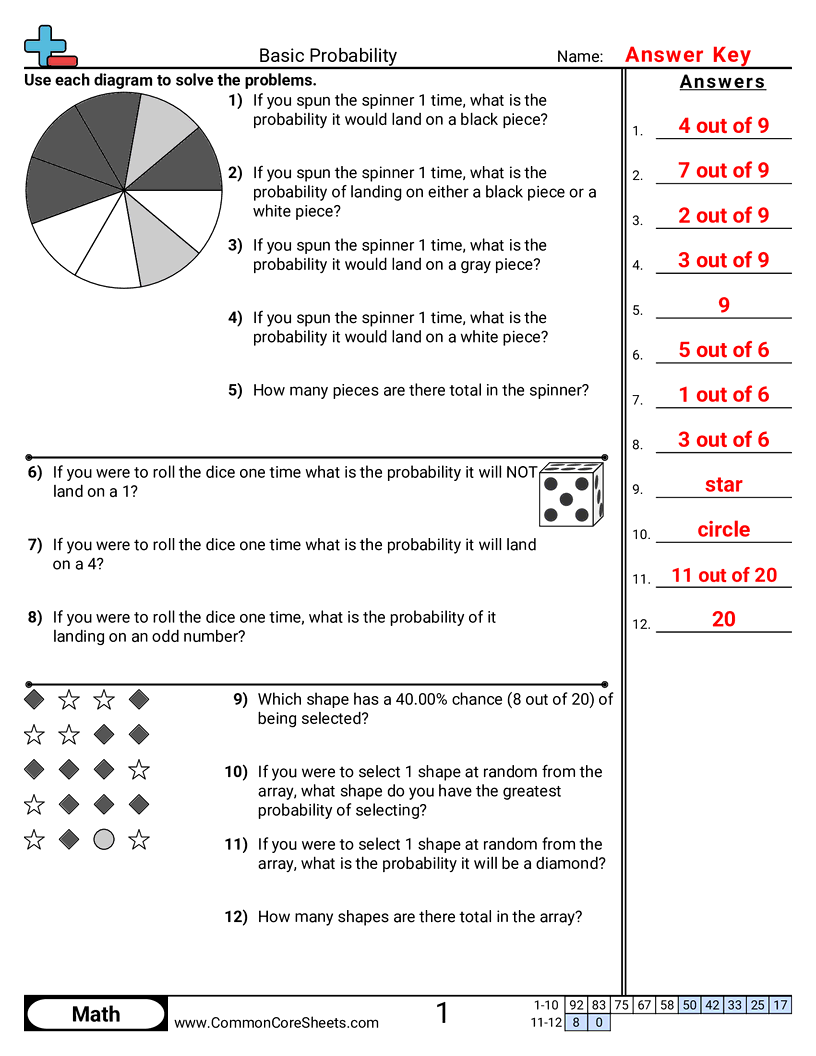
These graphing probability worksheets help students visualize and analyze probability concepts through charts and visual representations. Students work with candy selections, spinner wheels, dice, and object arrays to identify probabilities, most probable outcomes, and least probable selections. The graphing format makes abstract probability concepts more concrete and easier to understand.
Filter By Grade
Problem Type


About these worksheets
These worksheets introduce basic probability concepts through hands-on scenarios. Students determine the likelihood of selecting specific items from a set, identify most and least probable outcomes, and calculate probability using spinners, dice, and object arrays. Activities build an intuitive understanding of chance and likelihood.


One Atta Time

Flash Cards

Distance Learning

Create New Sheet

Select a Worksheet >
Version 1
Version 2
Version 3
Version 4
Version 5
Version 6
Version 7
Version 8
Version 9
Version 10
Grab 'em All
Basic Probability

- Find the probability of an event by counting favorable outcomes out of all possible outcomes.
- Read a spinner or die and list the possible outcomes in the sample space.
- Compare which event is more likely, less likely, or equally likely based on the numbers of outcomes.
- Use pictures or arrays of objects to calculate the chance of picking a certain item at random.

