


One Atta Time

Flash Cards

Distance Learning

Create New Sheet

Select a Worksheet >
Version 1
Version 2
Version 3
Version 4
Version 5
Version 6
Version 7
Version 8
Version 9
Version 10
Grab 'em All
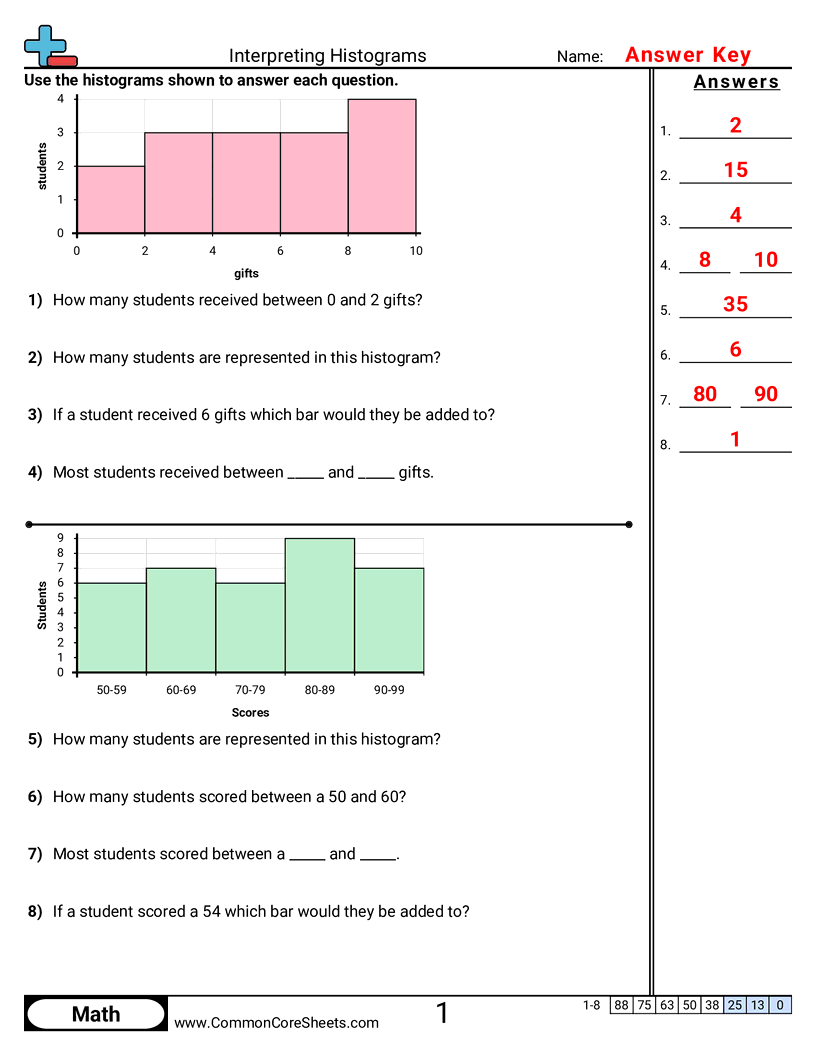
Interpreting Histograms


- Read a histogram and explain what the bars and labels mean.
- Find how many data points fall in a given interval (bin).
- Identify which interval has the most or least data.
- Compare two intervals to see where values are more common.

