Tally Graphs Worksheets
This section provides comprehensive tally graph worksheets that help students develop data interpretation and visualization skills. Students practice reading tally charts, connecting tally data to bar graphs and pictographs, and completing frequency tables using tally mark information across 29 engaging problems.


Tally Graphs
About these worksheets
Students work with tally-based data displays through a variety of activities. Worksheets include interpreting tally charts to answer questions, matching tally data to bar graphs, matching pictographs to tally charts, and filling in frequency tables from tally mark data. These resources build data literacy and help students connect different ways of representing the same information.


Interpreting a Tally Graph
Each worksheet has 10 problems interpreting info from a tally graph.


Version 1
Version 2
Version 3
Version 4
Version 5
Version 6
Version 7
Version 8
Version 9
Version 10
Grab 'em All
Create New Sheet
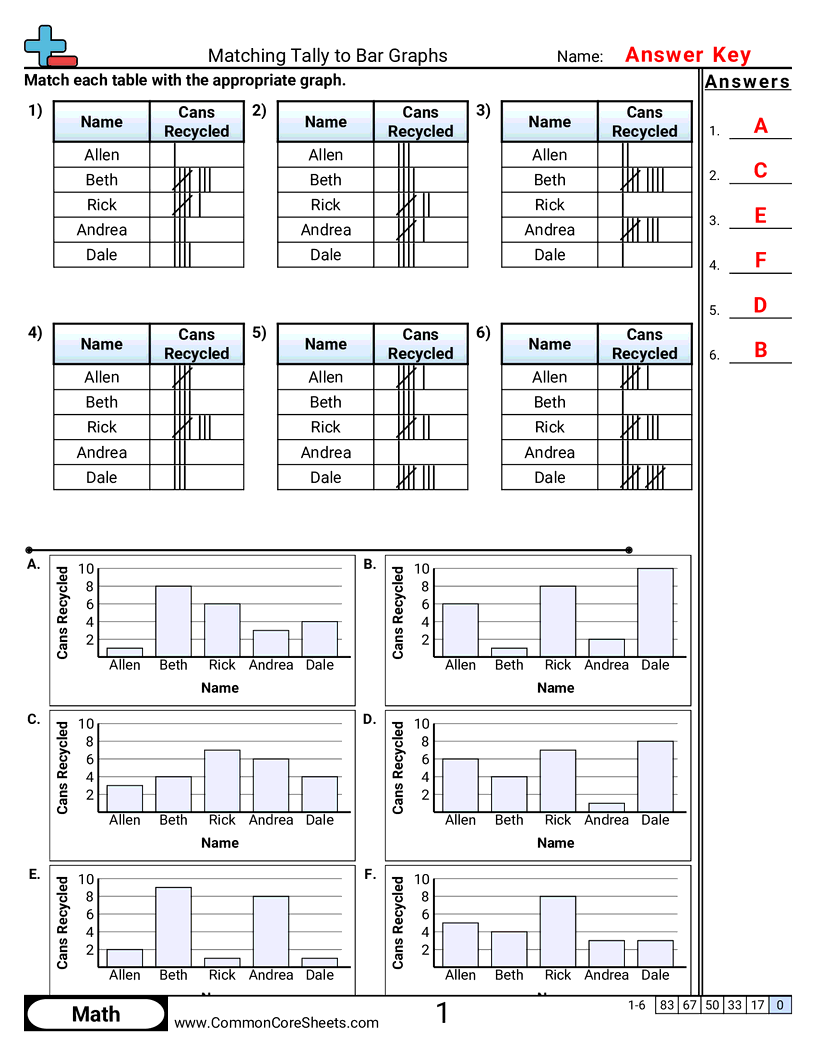
Matching Tally to Bar Graph
Each worksheet has 6 problems matching a table with tally marks to a bar graph.
Version 1
Version 2
Version 3
Version 4
Version 5
Version 6
Version 7
Version 8
Version 9
Version 10
Grab 'em All
Create New Sheet
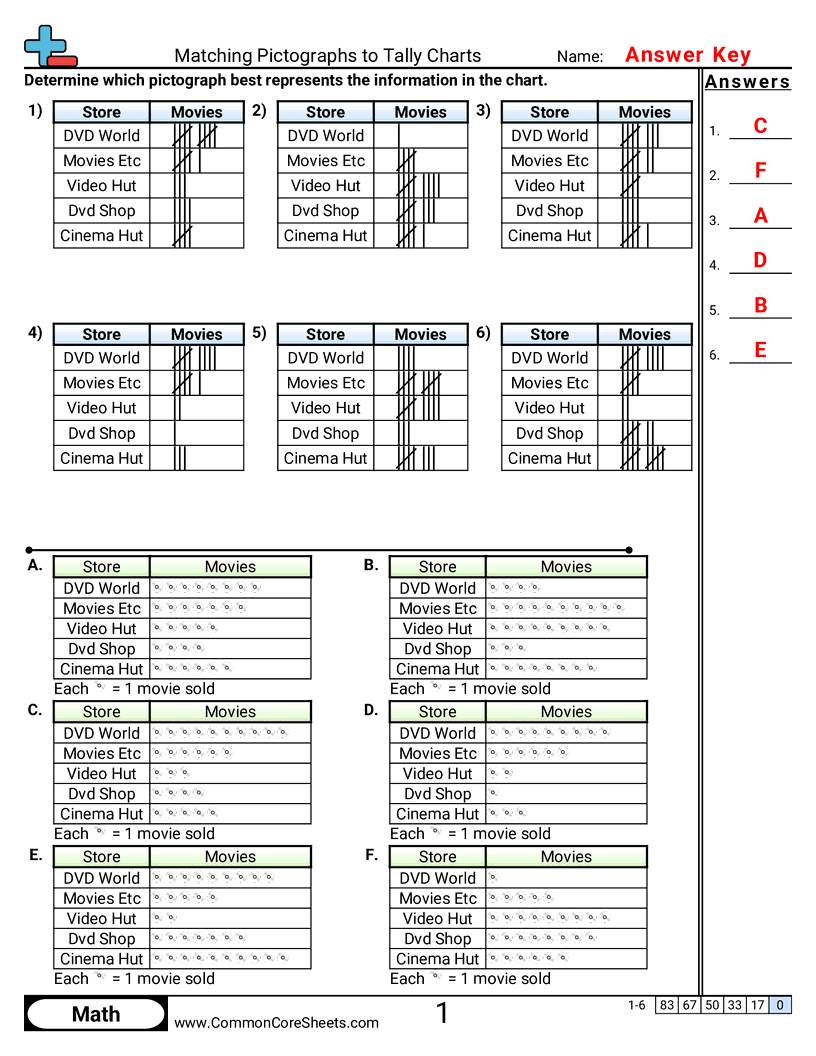
Matching Pictographs to Tally Charts
Each worksheet has 6 problems matching a tally chart to a pictograph.
Version 1
Version 2
Version 3
Version 4
Version 5
Version 6
Version 7
Version 8
Version 9
Version 10
Grab 'em All
Create New Sheet
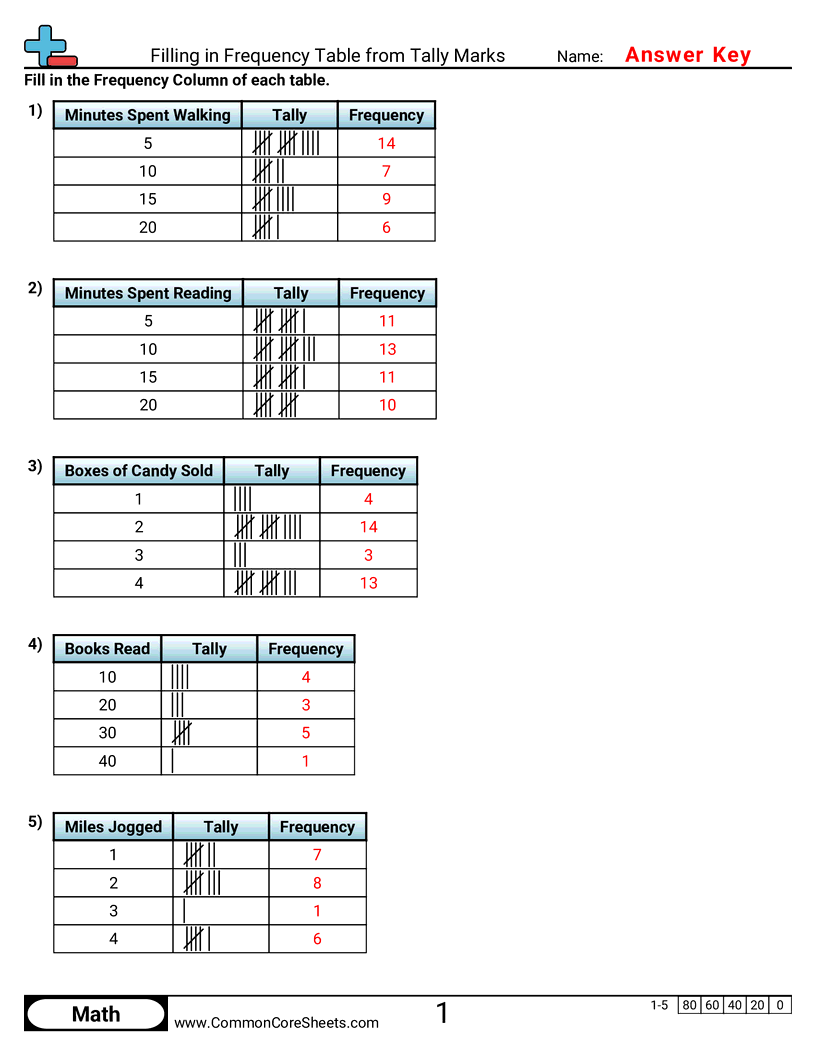
Filling in Frequency Table from Tally Marks
Each worksheet has 5 tables to fill in from information in tally marks.
Version 1
Version 2
Version 3
Version 4
Version 5
Version 6
Version 7
Version 8
Version 9
Version 10
Grab 'em All
Create New Sheet
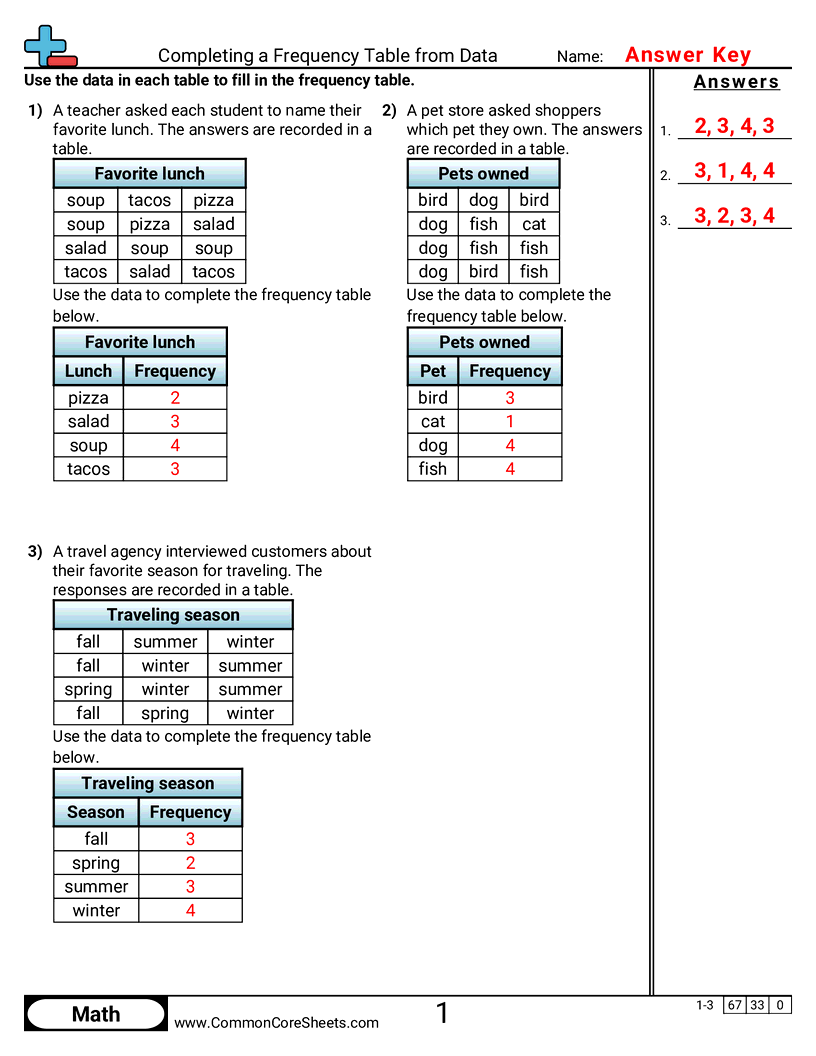
Students count how many times each answer appears in a set of raw responses and record the totals in a frequency table.
Version 1
Version 2
Version 3
Version 4
Version 5
Version 6
Version 7
Version 8
Version 9
Version 10
Grab 'em All
Create New Sheet

Each worksheet has 3 problems counting fractional measurements from a set of data and recording them in a frequency table.
Version 1
Version 2
Version 3
Version 4
Version 5
Version 6
Version 7
Version 8
Version 9
Version 10
Grab 'em All
Create New Sheet

Organizing Data into a Table
Each worksheet has 3 problems counting two groups of responses into a two-way table.
Version 1
Version 2
Version 3
Version 4
Version 5
Version 6
Version 7
Version 8
Version 9
Version 10
Grab 'em All
Create New Sheet

Organizing Data into a Table with Fractions and Decimals
Each worksheet has 3 problems counting measurements written as benchmark fractions or decimals into a two-way table.
Version 1
Version 2
Version 3
Version 4
Version 5
Version 6
Version 7
Version 8
Version 9
Version 10
Grab 'em All
Create New Sheet
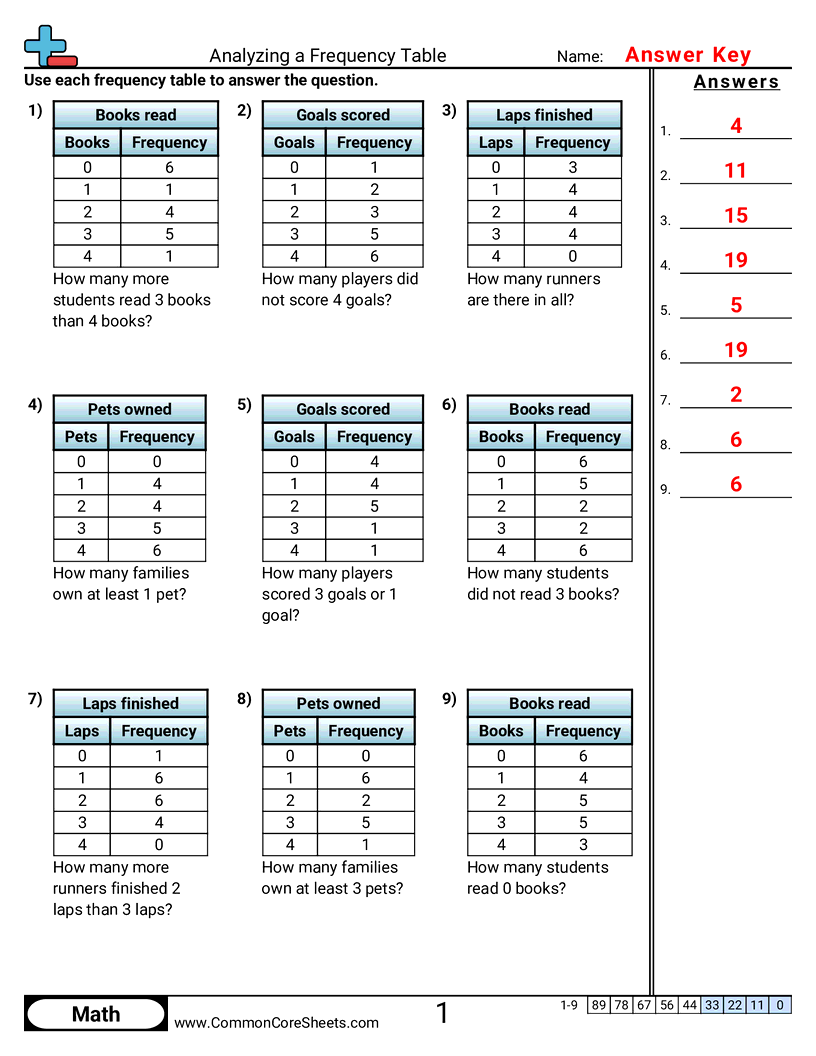
Each worksheet has 6 one- and two-step problems answered by reading a frequency table.
Version 1
Version 2
Version 3
Version 4
Version 5
Version 6
Version 7
Version 8
Version 9
Version 10
Grab 'em All
Create New Sheet

Each worksheet has 6 one- and two-step problems about a frequency table of benchmark fractions or decimals.
Version 1
Version 2
Version 3
Version 4
Version 5
Version 6
Version 7
Version 8
Version 9
Version 10
Grab 'em All
Create New Sheet