Matching Tally to Bar Graphs Worksheet Download
Free math worksheets on Matching Tally to Bar Graphs. Each worksheet has 6 problems with an answer key and are ideal for teachers and homeschooling. You can download the PDF, create a set of flash cards or set it up for online learning.
Select a Different Activity
>


Sheet Information >
About this worksheet
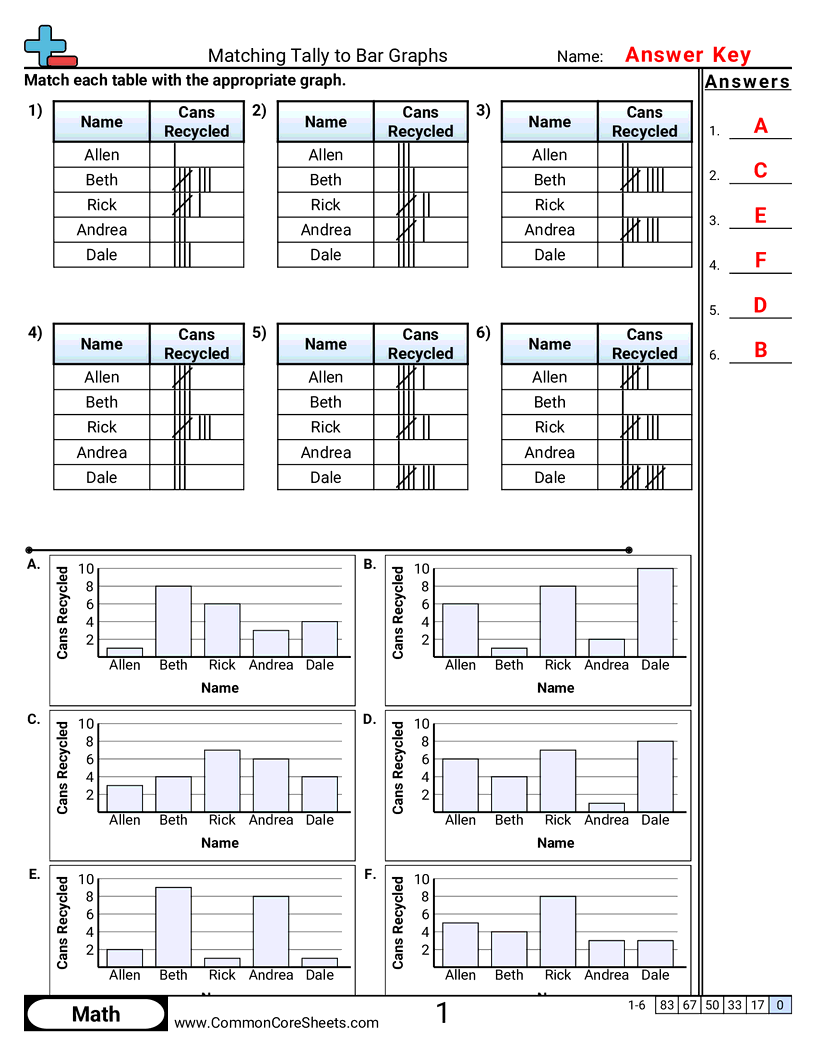
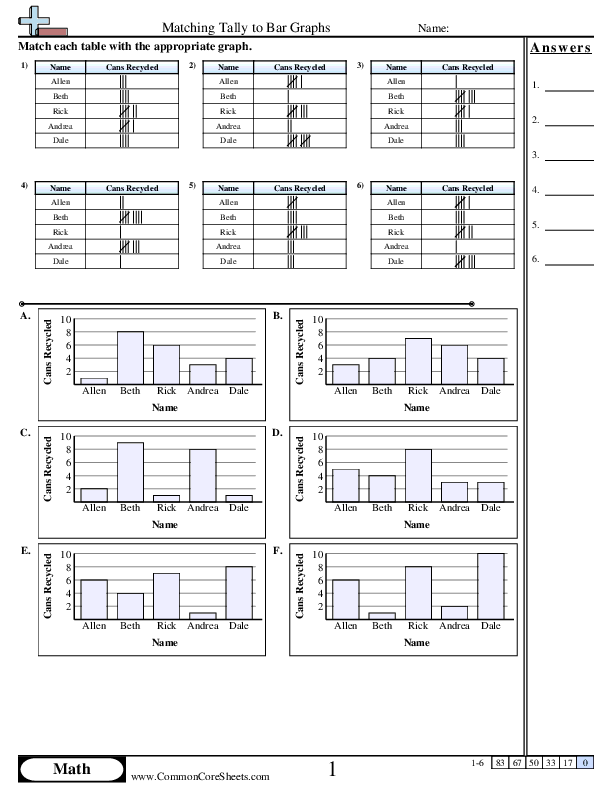
Each worksheet has 6 problems matching a table with tally marks to a bar graph.
This worksheet is designed to enhance children's proficiency in math, through solving six problems on matching tally to bar graphs. Customizable for specific learning objectives, it uses examples featuring names and the number of cans recycled to facilitate understanding. Adaptable as flash cards for interactive engagement, it is equally suited for distance learning environments, promoting continuous, self-paced mathematical development.
Student objectives
- Read tally marks and figure out the total count for each category.
- Read a bar graph and tell how many are in each category.
- Match a set of tally counts to the bar graph that shows the same data.
Everyday practice
- Count how many people chose each snack by making tally marks and then turning it into a quick bar graph.
- Keep a tally of sunny, cloudy, and rainy days for a week and compare the totals on a bar graph.
- Track how many times each chore gets done in a week using tallies and then compare the results on a chart.
- Record how many goals each player scores during a game with tally marks and compare players using a bar graph.