Scatter Plots Statistics Worksheets
Free statistics worksheets with answer key. No login or account needed. From answering statistical questions to analyzing data, we've got you covered. A grading column and quick grade scale make grading a breeze, and modified pages help with lower level learners or when just introducing a topic. Great for teachers or for homeschool.
Grade & filters
Filter By Grade


Scatter Plots
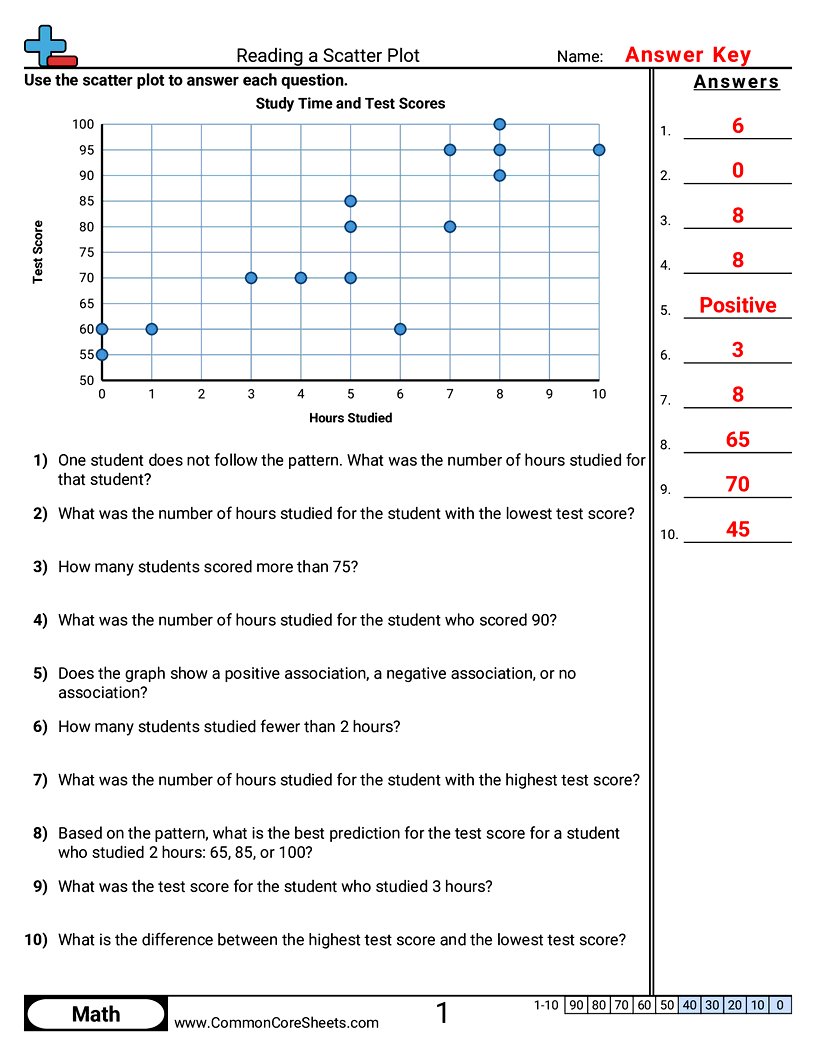


One scatter plot is shown at the top of the sheet and ten questions below it ask students to read points, count data above or below a value, find the outlier, name the association and predict from the trend.


Version 1
Version 2
Version 3
Version 4
Version 5
Version 6
Version 7
Version 8
Version 9
Version 10
Grab 'em All
Create New Sheet
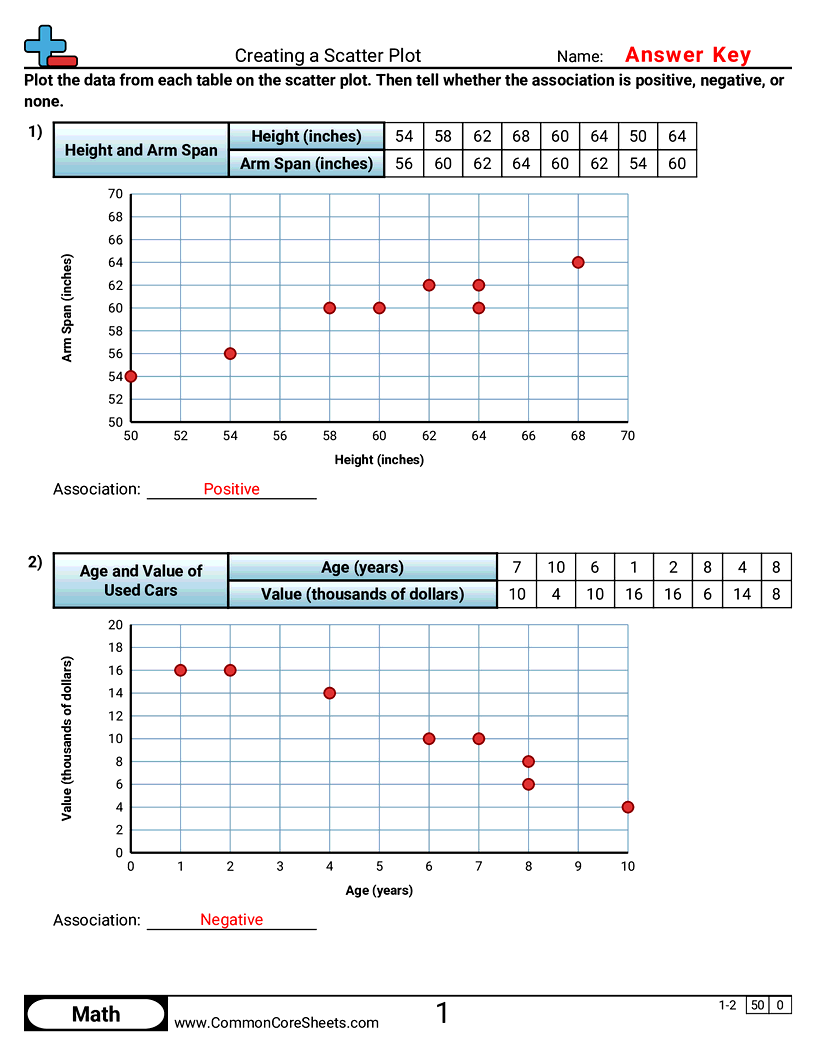
Students plot eight pairs of data from a table on a blank scatter plot, then decide whether the association is positive, negative, or none.
Version 1
Version 2
Version 3
Version 4
Version 5
Version 6
Version 7
Version 8
Version 9
Version 10
Grab 'em All
Create New Sheet
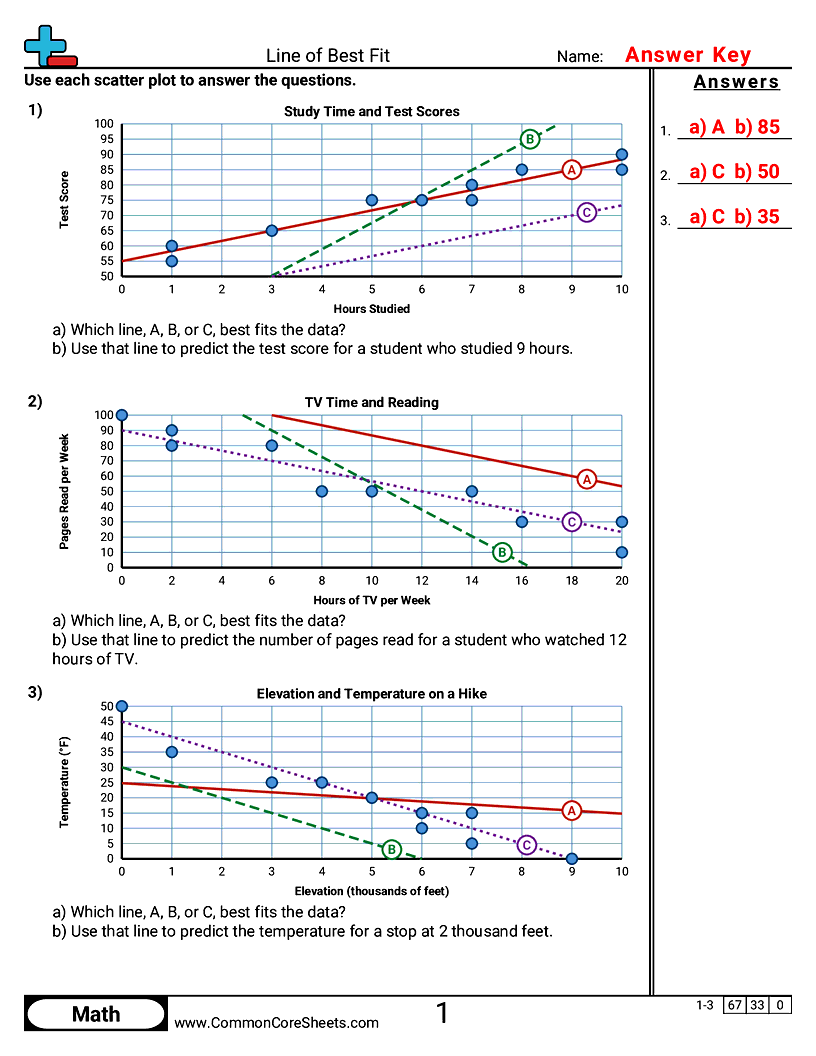
Each scatter plot has three lines drawn on it. Students pick the line that fits the data best, then use that line to make a prediction.
Version 1
Version 2
Version 3
Version 4
Version 5
Version 6
Version 7
Version 8
Version 9
Version 10
Grab 'em All
Create New Sheet