Line of Best Fit Worksheet Download


Sheet Information >
Line of Best Fit
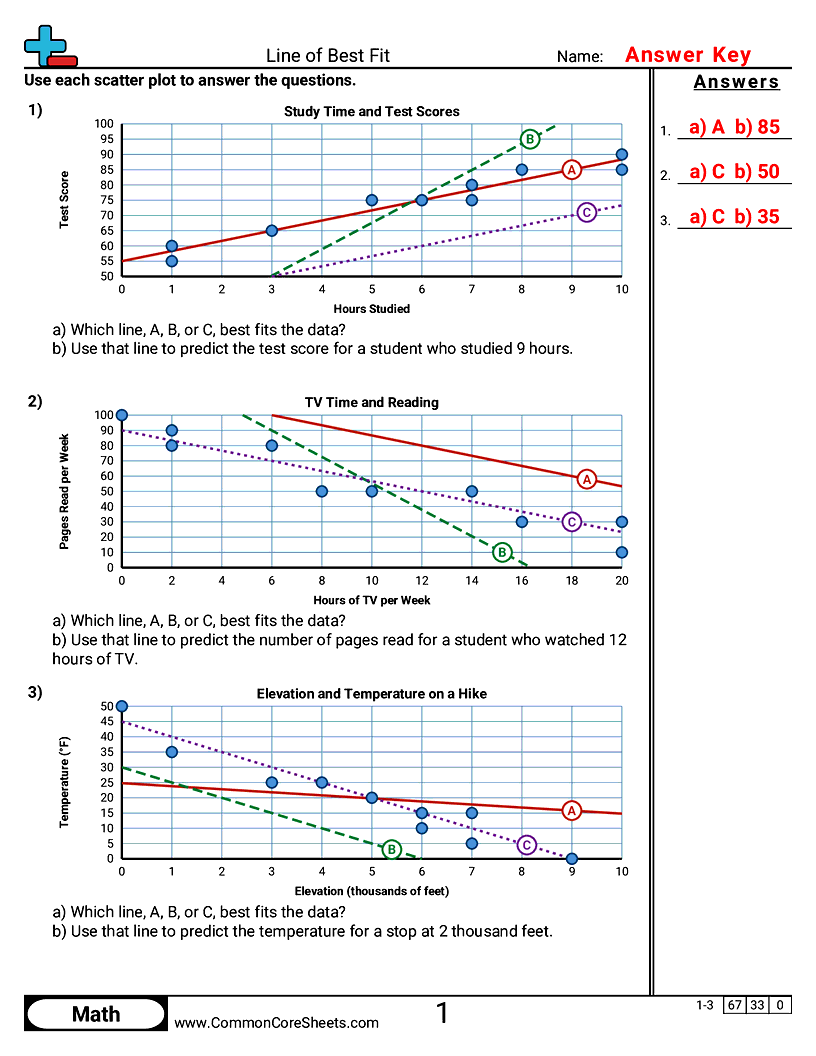
Each scatter plot has three lines drawn on it. Students pick the line that fits the data best, then use that line to make a prediction.
About this worksheet
Each scatter plot has three lines drawn on it. Students pick the line that fits the data best, then use that line to make a prediction.
Student objectives
- Judge how well a line fits by how close the points are to it
- Tell a line with the wrong slope from one in the wrong place
- Use a line of fit to make a prediction