These visual pictograph worksheets help students develop data interpretation skills through engaging graphic representations. Students practice reading pictographs to solve problems and matching pictographs to corresponding data charts. The visual format makes abstract data concepts more accessible and easier to understand.
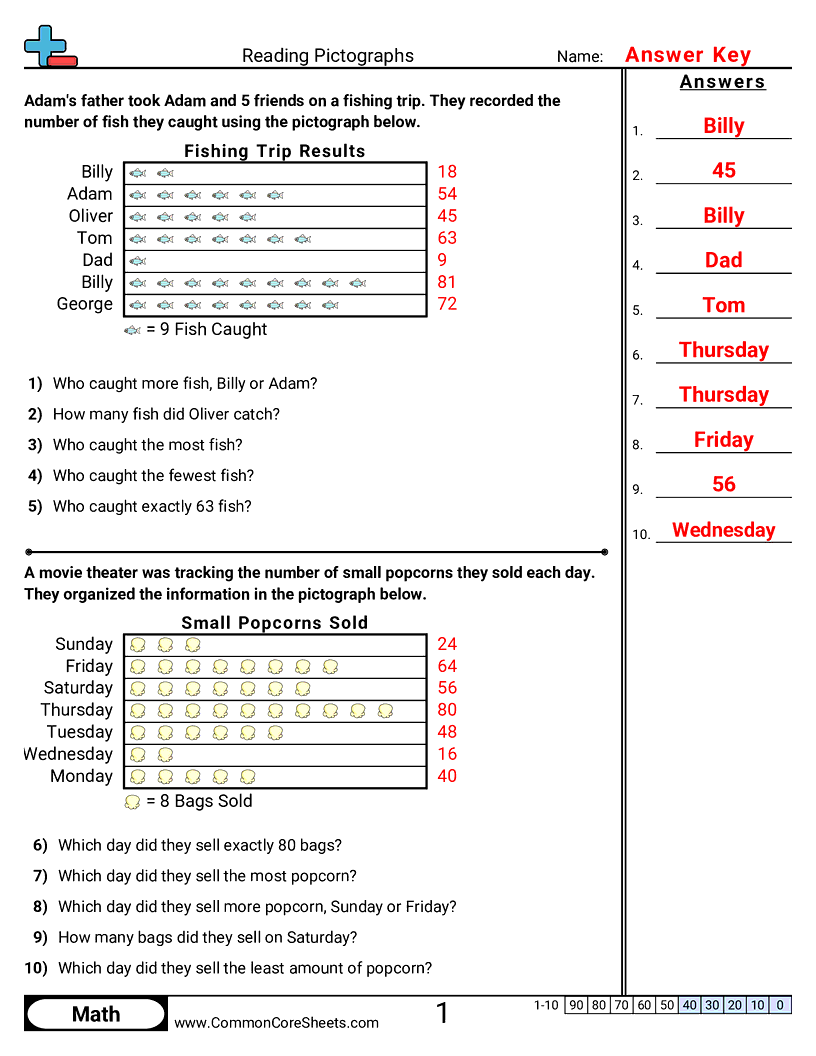
Students practice reading pictographs by using picture keys to determine values and answer comparison questions. Each worksheet presents a pictograph with multiple categories, and students interpret the symbols to find totals, compare groups, and draw conclusions from the data. Aligned with second grade measurement and data standards.
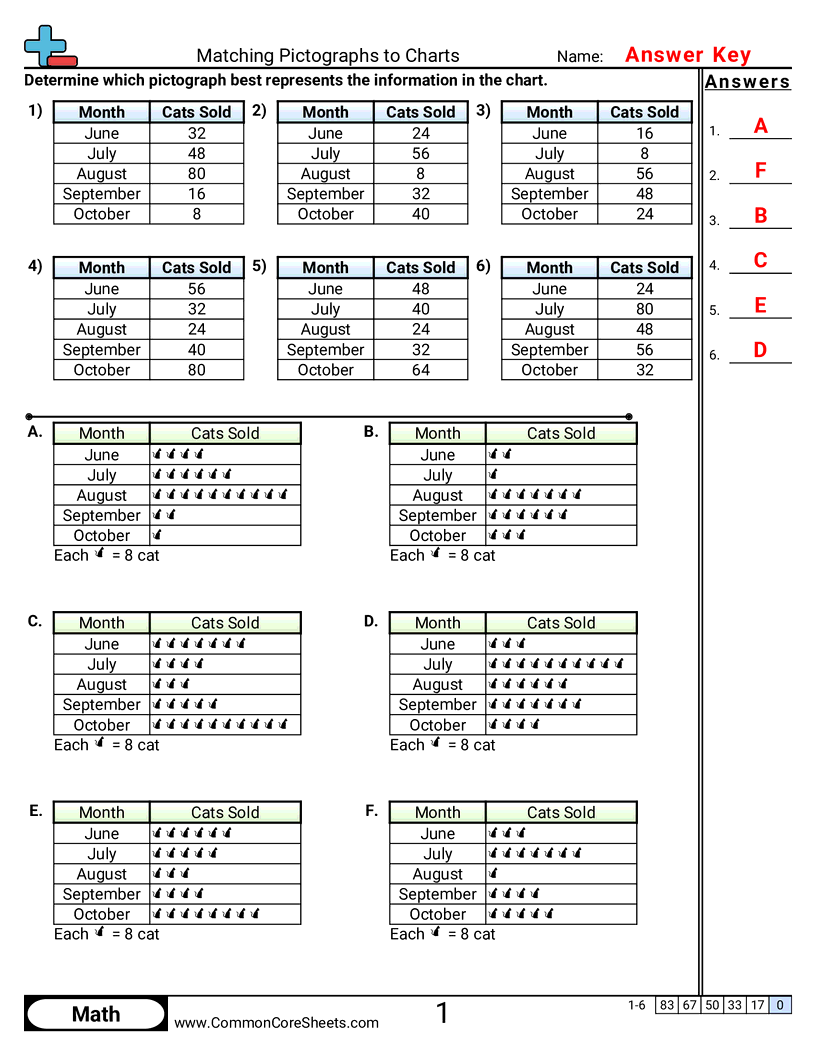
These worksheets ask students to match a pictograph to the data chart it represents. Students read the picture key, count symbols including partial symbols, and compare totals across categories to find the correct match. Aligned with second grade standards.