Organizing Charts
Each worksheet has 14 problems creating a chart from a set of data and then answering questions.
Student Objectives
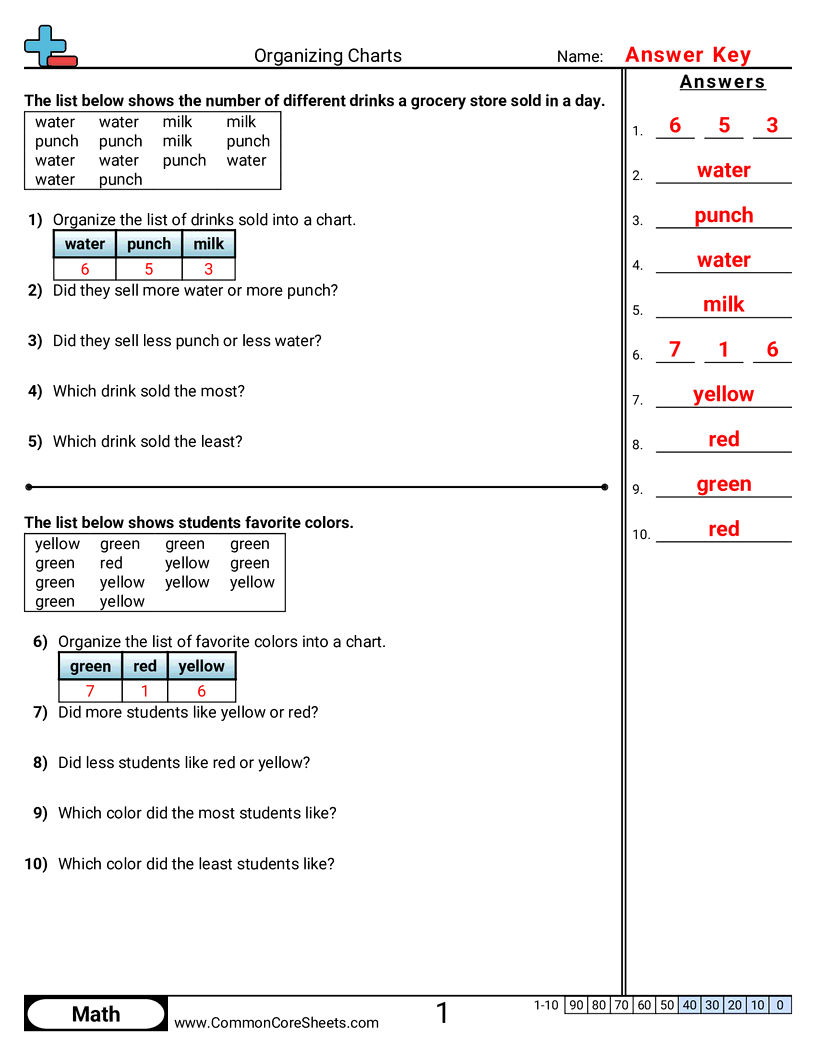
- Sort a set of information into clear categories before making a chart.
- Fill in a chart or table by counting how many items are in each category.
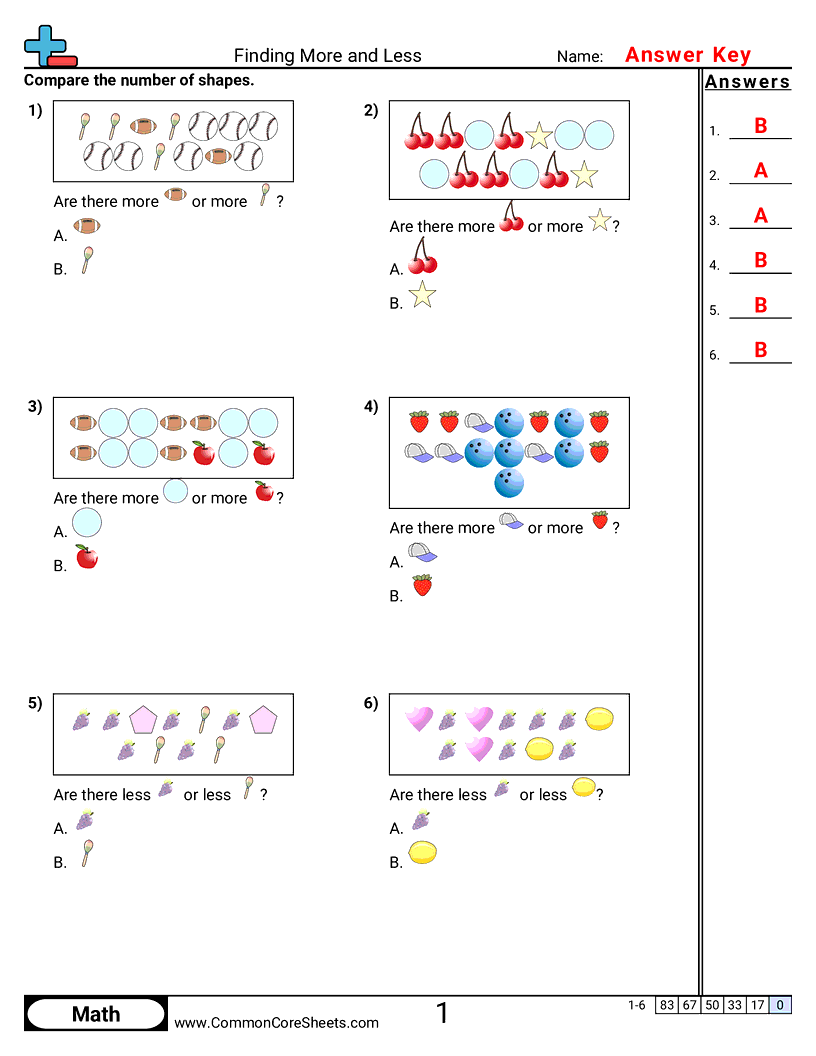
- Read a chart to answer questions about which category has more, less, or the same.
- Compare two categories by finding how many more or fewer items one has than the other.
Tags
Standards