Interpreting a line plot
Each worksheet has 11 problems answering questions from a line plot.
Student Objectives
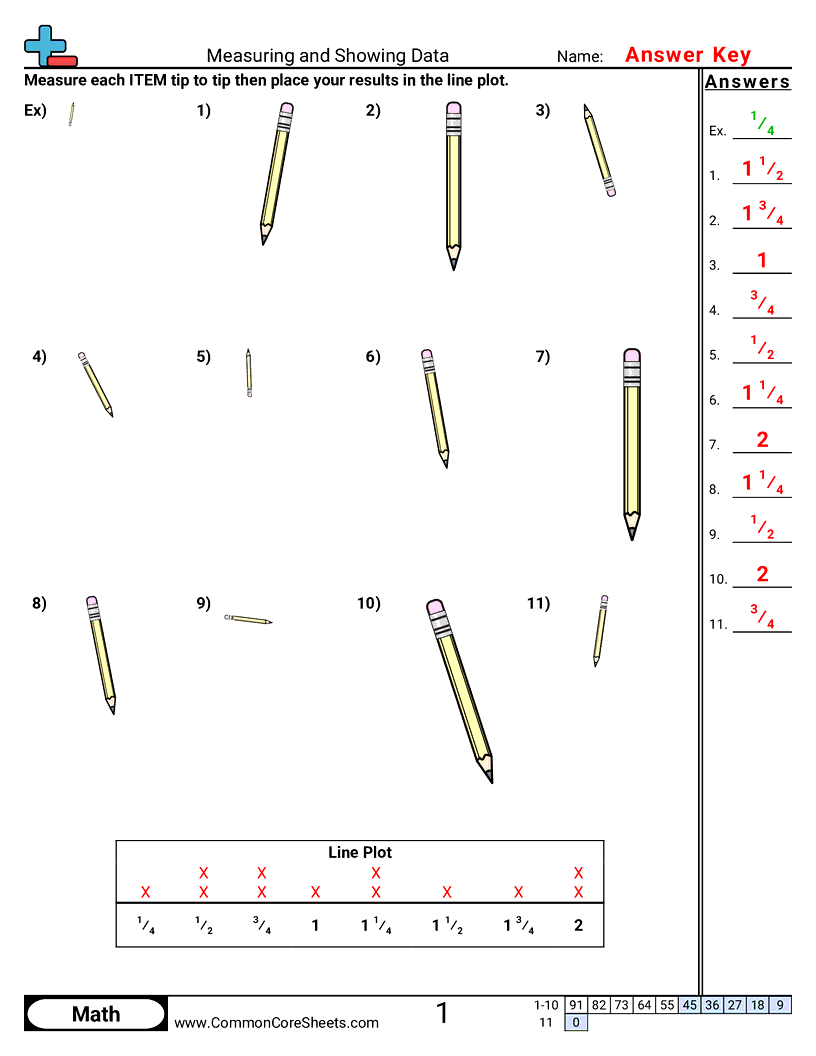
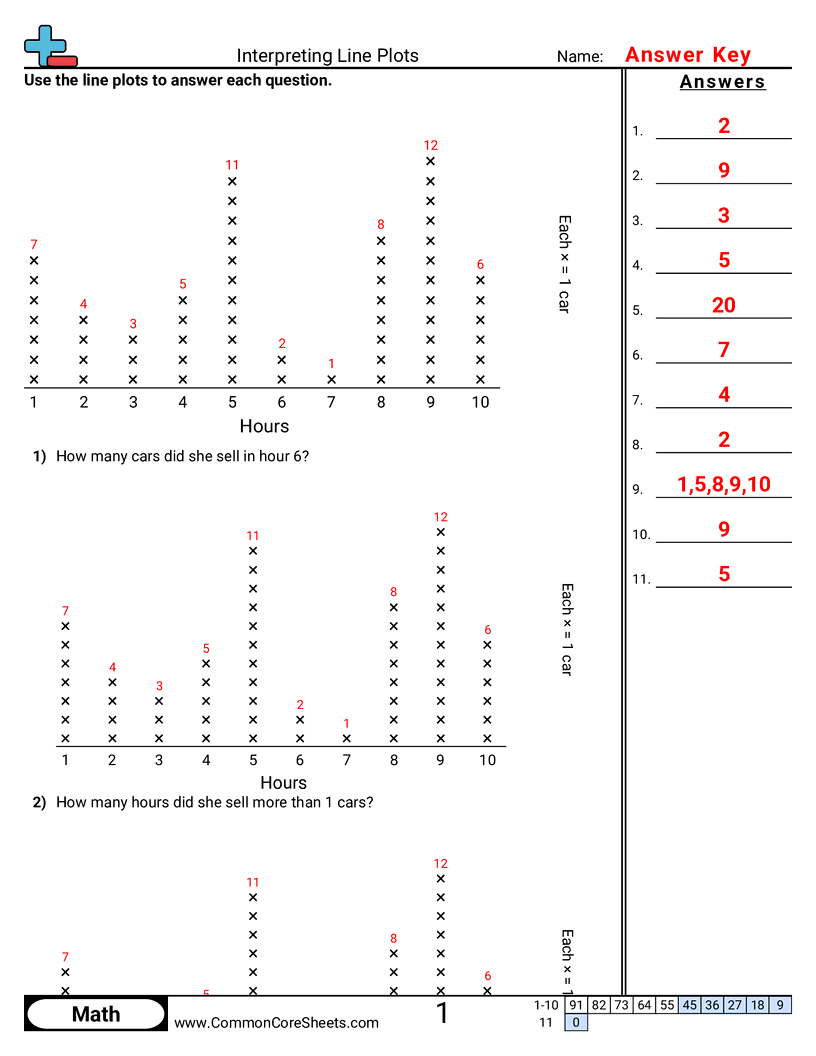
- Read a line plot to find how many times each value shows up.
- Answer questions about the data, like which value happens most and least often.
- Compare two values on the line plot to see which has more data points and by how many.
- Find the total number of data points shown on the line plot.
- Use the line plot to figure out the range of the data (highest value minus lowest value).
Tags
Standards