Completing a Line Plot from a Table Worksheet Download
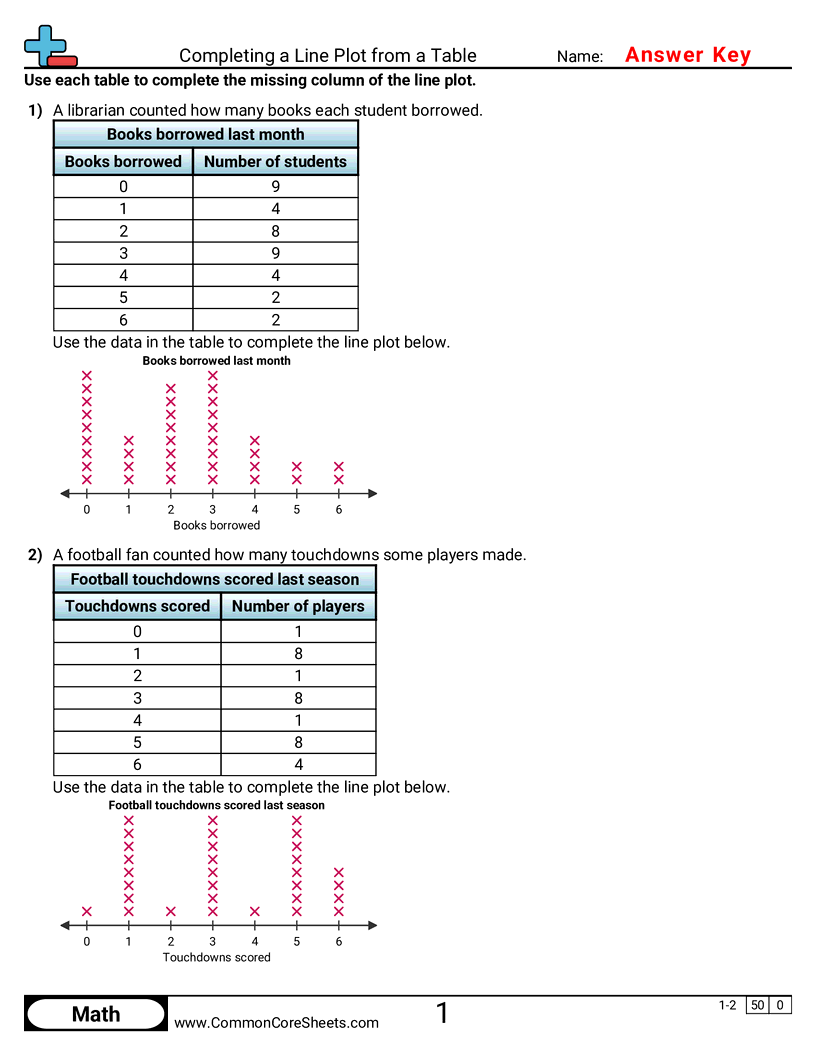
This worksheet pairs a frequency table with a line plot that is missing one of its columns. The counts are already tabulated, so the work is transferring a frequency onto the plot and stacking the right number of X's above the correct number. On the printed page that column is left blank and the answer key fills it in; online the column is a stack of faded X's, clicking one selects up to it, and clicking the number line beneath the column clears it. Sheet 581 builds a line plot from a raw list of numbers instead, and in fractions.


Sheet Information >
Completing a Line Plot from a Table
Students read a frequency table and complete the missing column of X's on a line plot.
About this worksheet
Students read a frequency table and complete the missing column of X's on a line plot.
Student objectives
- Read data values from a table
- Count how many times each value appears
- Place the correct number of marks above each number on a line plot
- Match a completed line plot to the data in a table
Everyday practice
- Track how many days it rained each week and mark it on a chart
- Count how many of each color candy you have and plot the results
- Show how many books your friends read by making a simple chart
- Record daily temperatures and mark each one on a number line