Interpreting Line Plots: Interpreting a line plot Worksheet Download
Free 3rd Grade (3md4) math worksheets on Interpreting Line Plots . Each worksheet has 11 problems with an answer key and are ideal for teachers and homeschooling. You can download the PDF, create a set of flash cards or set it up for online learning.
Select a Different Activity
>


Sheet Information >
About this worksheet
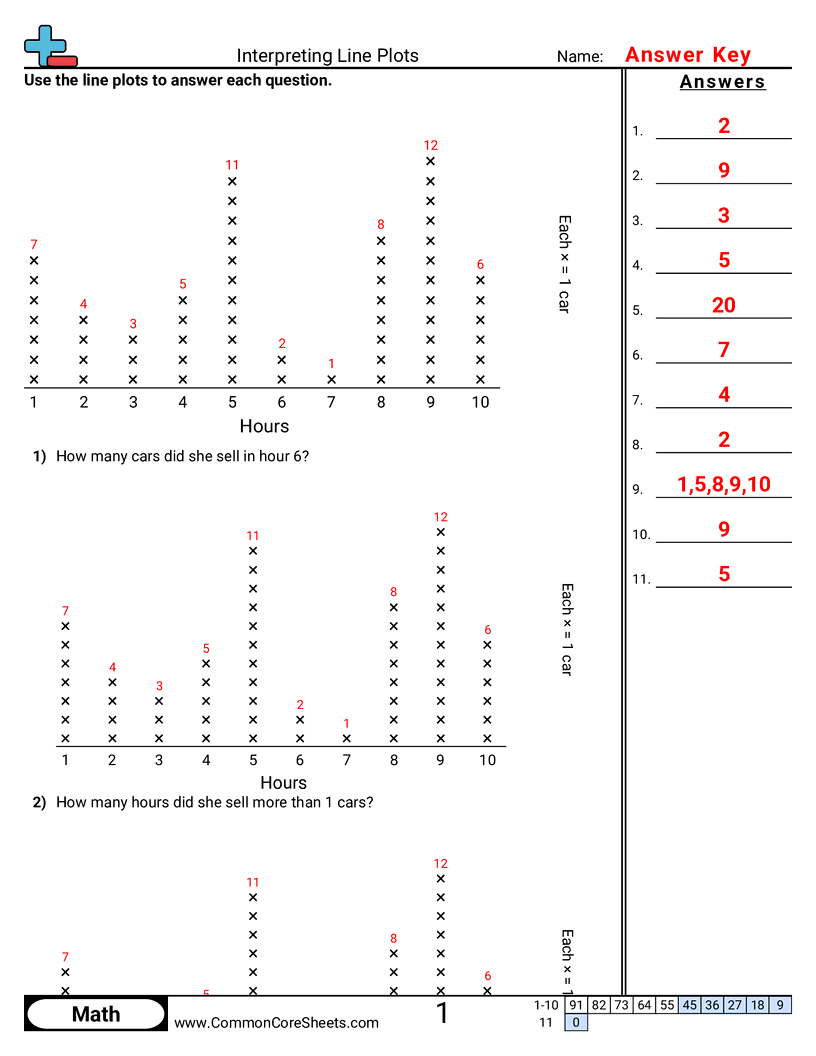
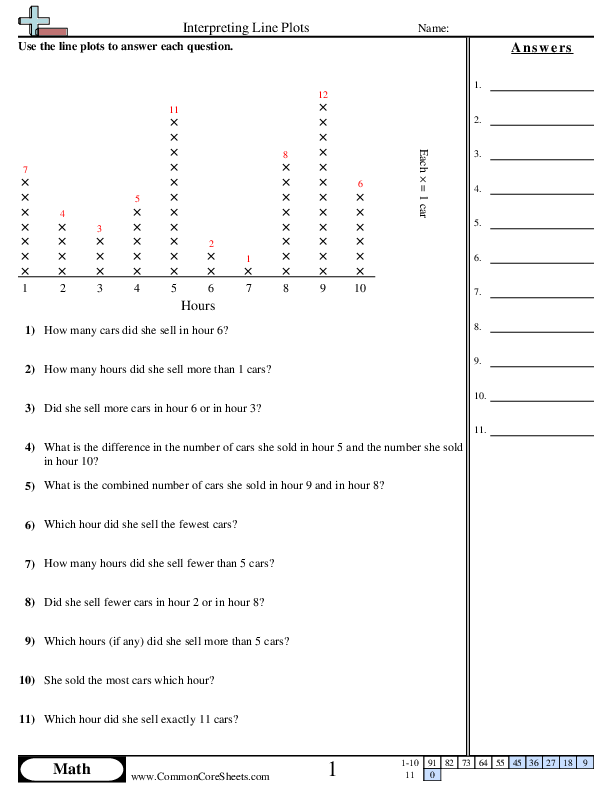
Each worksheet has 11 problems answering questions from a line plot.
This worksheet is designed to educate children about interpreting line plots in math. Through 11 engaging problems, students analyze data to answer questions concerning customer frequency per day. Concepts covered include data comparison and deduction. The worksheet promotes versatile learning, it can be customized to individual needs, transformed into flashcards for quick study or conveniently adapted for distance learning situations.
Student objectives
- Read a line plot to find how many times each value shows up.
- Answer questions about the data, like which value happens most and least often.
- Compare two values on the line plot to see which has more data points and by how many.
- Find the total number of data points shown on the line plot.
- Use the line plot to figure out the range of the data (highest value minus lowest value).
Everyday practice
- Look at a class chart of favorite ice cream flavors and tell which flavor got the most votes.
- Check a weather chart of daily temperatures and find the highest and lowest temperature for the week.
- Read a team chart of points scored each game and count how many games had the same score.
- Use a chart of how many pages you read each day to see which day had the most pages and how many days matched a number.