Identifying Y Intercept (Graphs) Worksheet Download
Free 8th Grade (8f2) math worksheets on Identifying Y Intercept (Graphs). Each worksheet has 6 problems with an answer key and are ideal for teachers and homeschooling. You can download the PDF, create a set of flash cards or set it up for online learning.
Select a Different Activity
>


Sheet Information >
Identifying Y Intercept (Graphs)
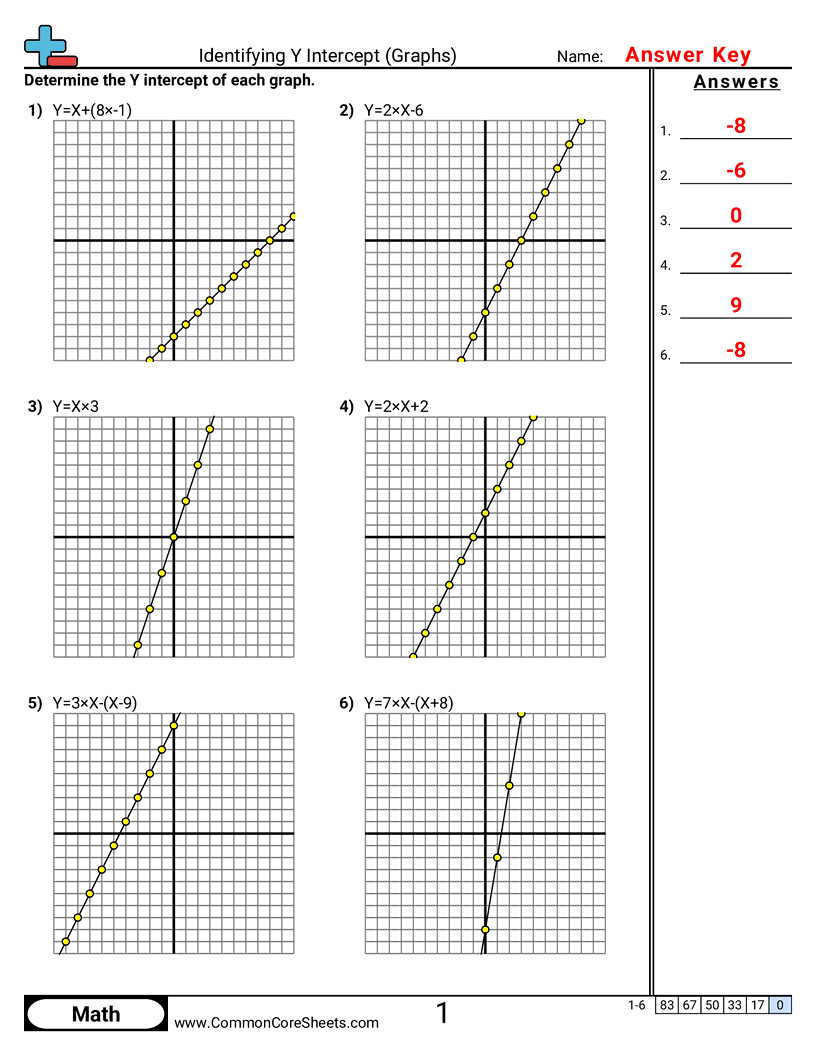
Each worksheet has 6 problems determining the Y intercept of a graph.
About this worksheet
Each worksheet has 6 problems determining the Y intercept of a graph.
This worksheet is designed to aid in the learning of a vital math concept: Identifying the Y Intercept in Graphs. With a variety of 6 problems ranging from simple to complex equations, like Y=6X+5 or Y=X-(5X-1), it's perfect for learners at different stages. The customizable worksheet can be converted into flashcards or integrated into distance learning for enhanced flexibility and convenience.
Student objectives
- Find the y-intercept on a graph by locating where the line crosses the y-axis.
- Read the y-value at x = 0 and write it as an ordered pair (0, y).
- Use the graph’s scale and tick marks to get the correct y-intercept value, including negatives.
- Tell the difference between the y-intercept and other points where the line crosses the x-axis.
Everyday practice
- Read a distance-over-time graph and find the starting distance at time 0.
- Read a money-over-time graph and find the starting amount at day 0.
- Look at a temperature graph for the day and find the temperature at 0 hours (midnight).
- Use a phone battery graph to see the battery level at the start of the time period shown.
Standards
Tags
visualgraphing