Identifying Rate of Change (Tables) Worksheet Download
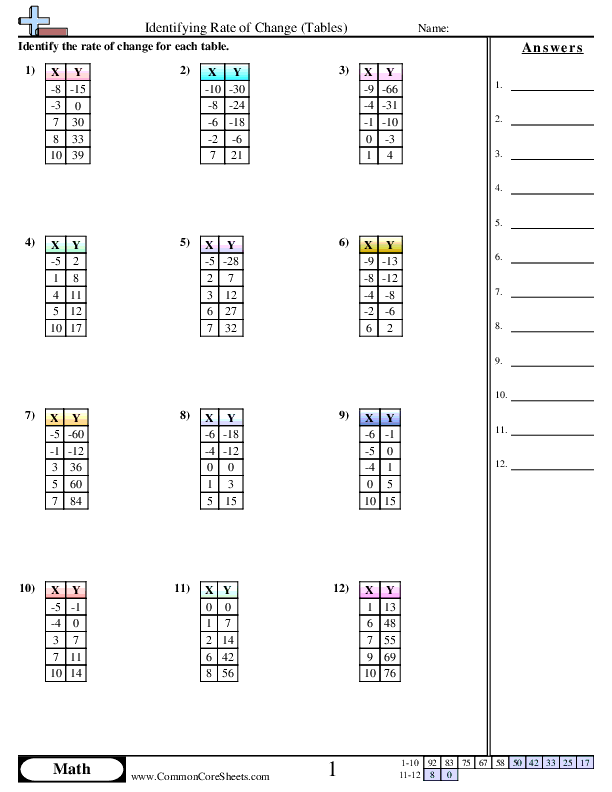
Free 8th Grade (8f2) math worksheets on Identifying Rate of Change (Tables). Each worksheet has 12 problems with an answer key and are ideal for teachers and homeschooling. You can download the PDF, create a set of flash cards or set it up for online learning.
Select a Different Activity
>


Sheet Information >

About this worksheet
Each worksheet has 12 problems identifying the rate of change using information in a table.
This worksheet is designed to help children grasp the mathematical concept of identifying the rate of change from tables. Comprising of 12 engaging problems, it presents scenarios that allow learners to decode patterns and sequences. This versatile sheet can be customized according to different learning preferences, transformed into flashcards for more tactile learning, or utilized remotely for distance learning ensuring its compatibility with various teaching approaches.
Student objectives
- Practice finding the rate of change from a table by calculating how much y changes for each unit change in x
- Use the formula (change in y) ÷ (change in x) between pairs of values in the table
- Work with tables that include negative numbers and values that aren't evenly spaced
Everyday practice
- Compare two phone plans by looking at a table of total cost for different numbers of gigabytes and finding the cost per gigabyte.
- Use a table of distance over time to figure out a runner’s speed in miles per minute.
- Check a table of hourly pay to see how much your earnings increase for each extra hour worked.
- Look at a table of recipe servings and ingredient amounts to find how much the ingredient increases per added serving.
- Use a table of taxi fares to find the charge per mile and predict the cost for a longer trip.