Identifying Rate of Change Between Two Sets Worksheet Download
Free 8th Grade (8ee5) math worksheets on Identifying Rate of Change Between Two Sets. Each worksheet has 6 problems with an answer key and are ideal for teachers and homeschooling. You can download the PDF, create a set of flash cards or set it up for online learning.
Select a Different Activity
>


Sheet Information >
About this worksheet
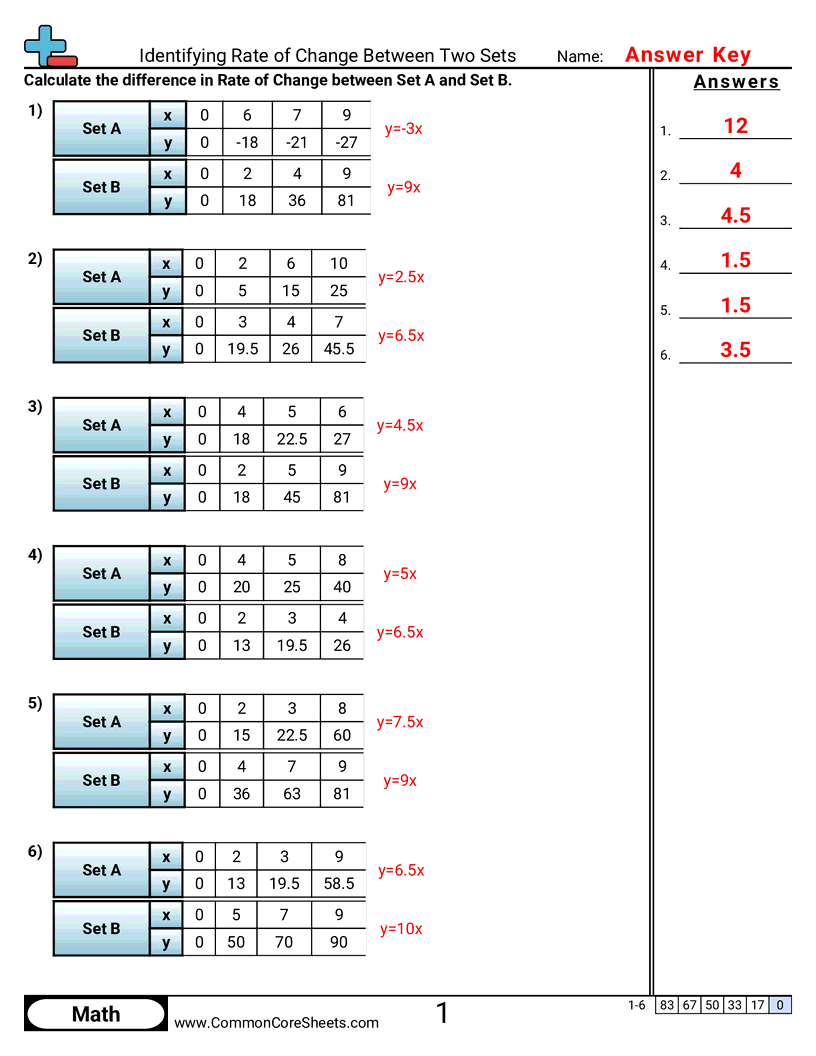
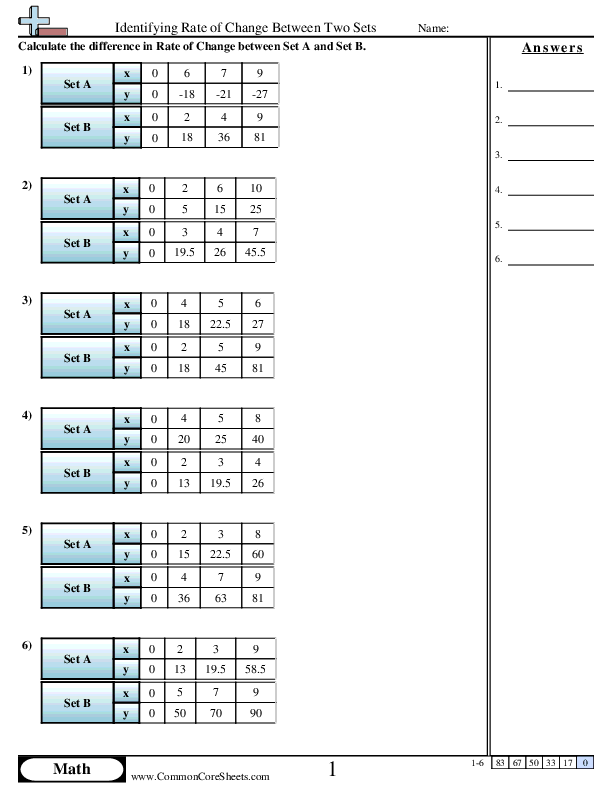
Each worksheet has 6 problems comparing the difference in rate of change between two sets.
This worksheet is designed to reinforce a child's understanding of the mathematical concept of rate of change between two sets. Through six problems, learners are challenged to analyze varying x and y values to identify the rate of change. Adaptable to individual needs, the content can be customized, used as flash cards for more interactive learning, or incorporated into distance learning modules, adding versatility to its utility in enhancing math competencies.
Student objectives
- Practice finding the rate of change (slope) for two different proportional relationships given as tables
- Calculate the difference between the two rates of change
- Work with rates that include decimals and negative numbers
Everyday practice
- Compare two phone plans by looking at how much the bill increases for each extra gigabyte of data.
- Decide which ride-share option costs more per mile by comparing price changes as distance increases.
- Compare two people’s walking speeds by checking how many miles each one adds per hour.
- Pick the better deal between two bulk items by comparing cost per ounce from a price table.
- Compare two savings plans by seeing how much money each one adds per week.