Identify Linear Functions (Table) Worksheet Download
Free 8th Grade (8f3) math worksheets on Identify Linear Functions (Table). Each worksheet has 12 problems with an answer key and are ideal for teachers and homeschooling. You can download the PDF, create a set of flash cards or set it up for online learning.
Select a Different Activity
>


Sheet Information >
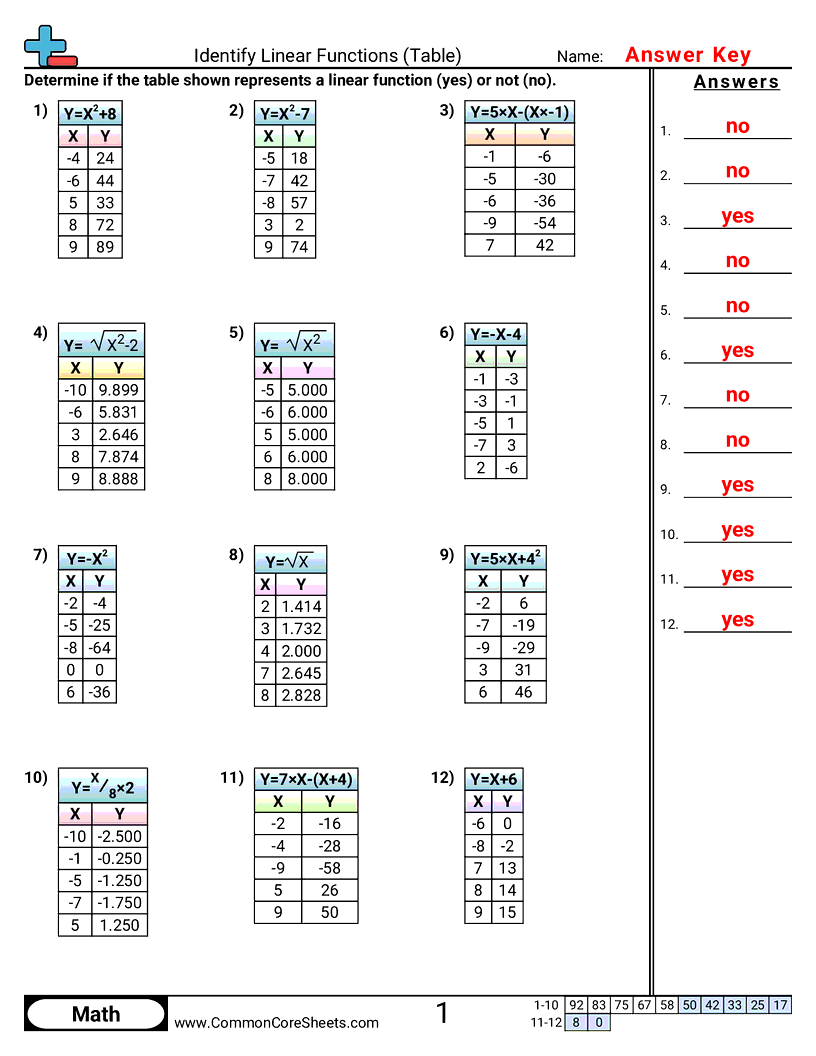
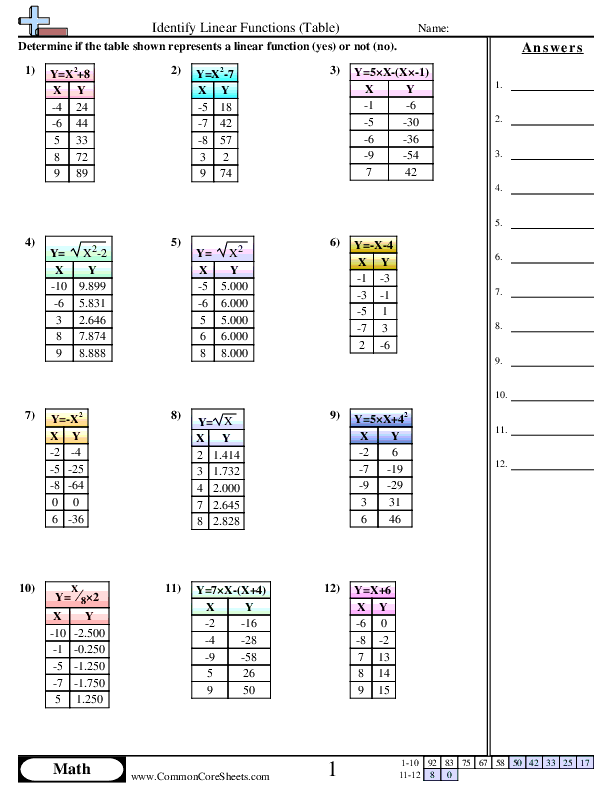
About this worksheet
Each worksheet has 16 problems determining if a table describes a linear equation.
This worksheet is designed to help children master identify linear functions. Comprising 12 math problems, it utilizes equations and tables format to illustrate concepts effectively. Examples range from simple arithmetic to more complex operations. The flexible format allows it to be customized, converted into flashcards, or adapted for distance learning environments, enhancing its utility in diverse educational settings.
Student objectives
- Decide whether a table of input and output values follows a linear rule.
- Check if the output changes by a constant amount when the input increases by the same amount.
- Find the rate of change (slope) from a table by comparing how much the output changes to how much the input changes.
- Spot tables that are not linear because the differences in the outputs are not consistent.
Everyday practice
- Look at a phone plan chart to see if the total cost goes up by the same amount for each extra gigabyte of data.
- Check a taxi or rideshare fare table to see if the price increases by a constant amount per mile.
- Compare a pay chart to see if earnings increase by the same amount for each extra hour worked.
- Use a recipe scaling chart to see whether ingredient amounts increase at a steady rate as the number of servings increases.