Distributing Line Plots Values
Each worksheet has 6 problems reading a line plot and distributing the values.
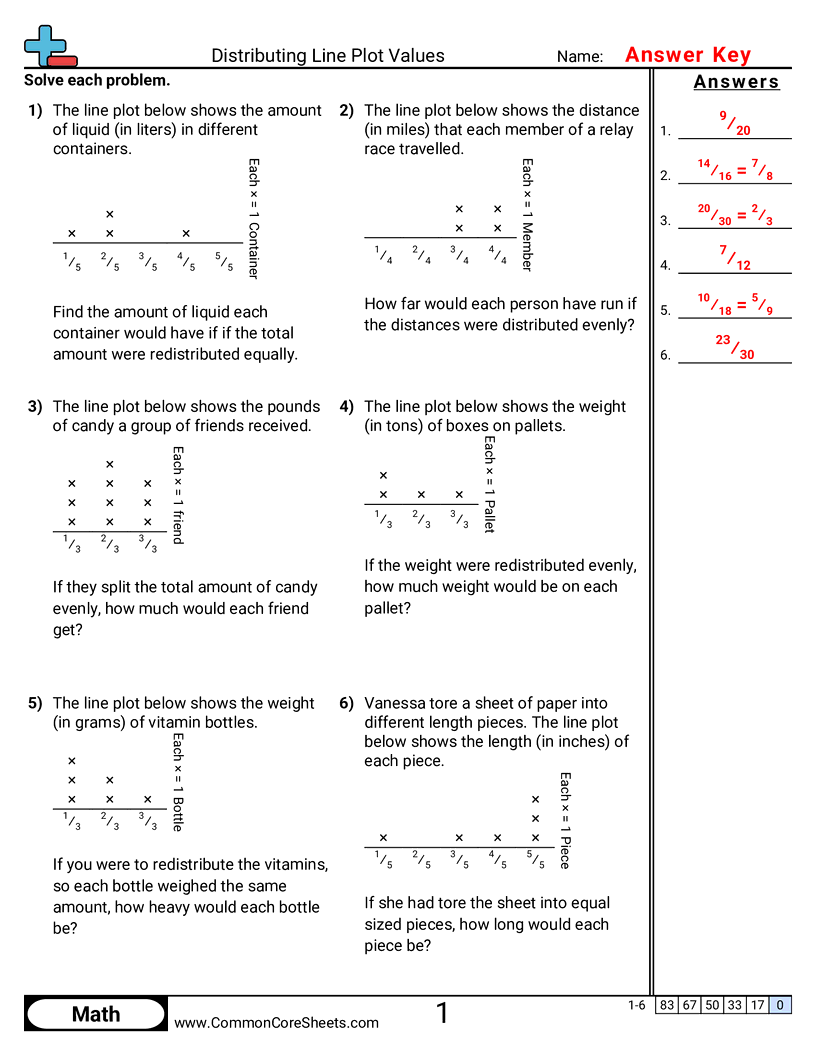
Student Objectives
- Read a line plot and tell how many data points are at each fraction measurement.
- Add up fractional measurements from a line plot to find the total amount.
- Split the total from a line plot into equal shares and figure out how much each share gets.
- Use the data on a line plot to answer questions about how the measurements are distributed.
Tags
Standards