Creating a Double Bar Graph with Decimals Worksheet Download
Free 5th Grade math worksheets on Creating a Double Bar Graph with Decimals. Each worksheet has 3 problems with an answer key and are ideal for teachers and homeschooling. You can download the PDF, create a set of flash cards or set it up for online learning.
Select a Different Activity
>


Sheet Information >
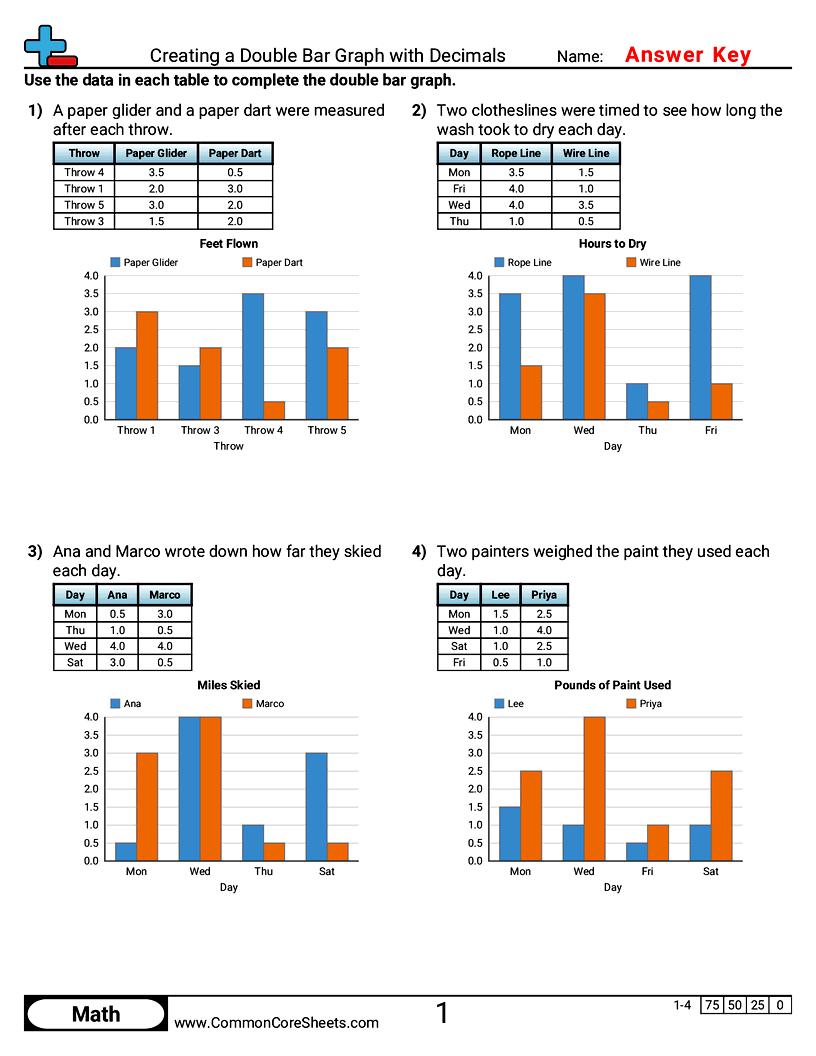
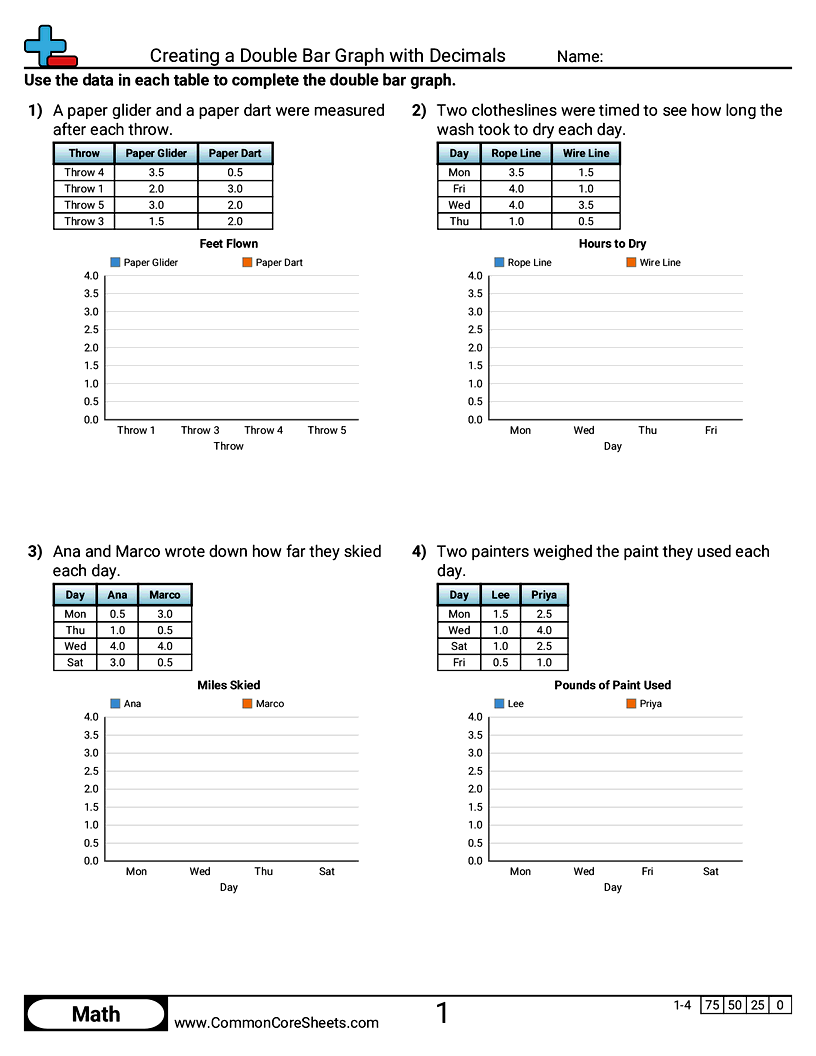
About this worksheet
Each worksheet has 3 problems drawing a double bar graph on a scale that counts by half units, labelled in decimals.
This worksheet gives a table of two data sets written in decimals and an empty grid marked in half units, and asks the student to draw every bar of a double bar graph. Because the gridlines are worth 0.5 rather than a whole, a student has to work out what each line is worth before a single bar can be drawn. Sheets can be customized, turned into flash cards, or assigned for online learning.
Student objectives
- Read decimal values from an unsorted table.
- Draw a pair of bars against a scale marked in half units.
- Use a legend to decide which bar is which.
Everyday practice
- Point out a scale that counts by halves.
- Say which two gridlines a value like 2.5 sits between.
- Check both bars against the table before moving on.