Identifying Constant of Proportionality (Graphs) Worksheet Download
Free 7th Grade (7rp2b) math worksheets on Identifying Constant of Proportionality (Graphs). Each worksheet has 8 problems with an answer key and are ideal for teachers and homeschooling. You can download the PDF, create a set of flash cards or set it up for online learning.
Select a Different Activity
>


Sheet Information >
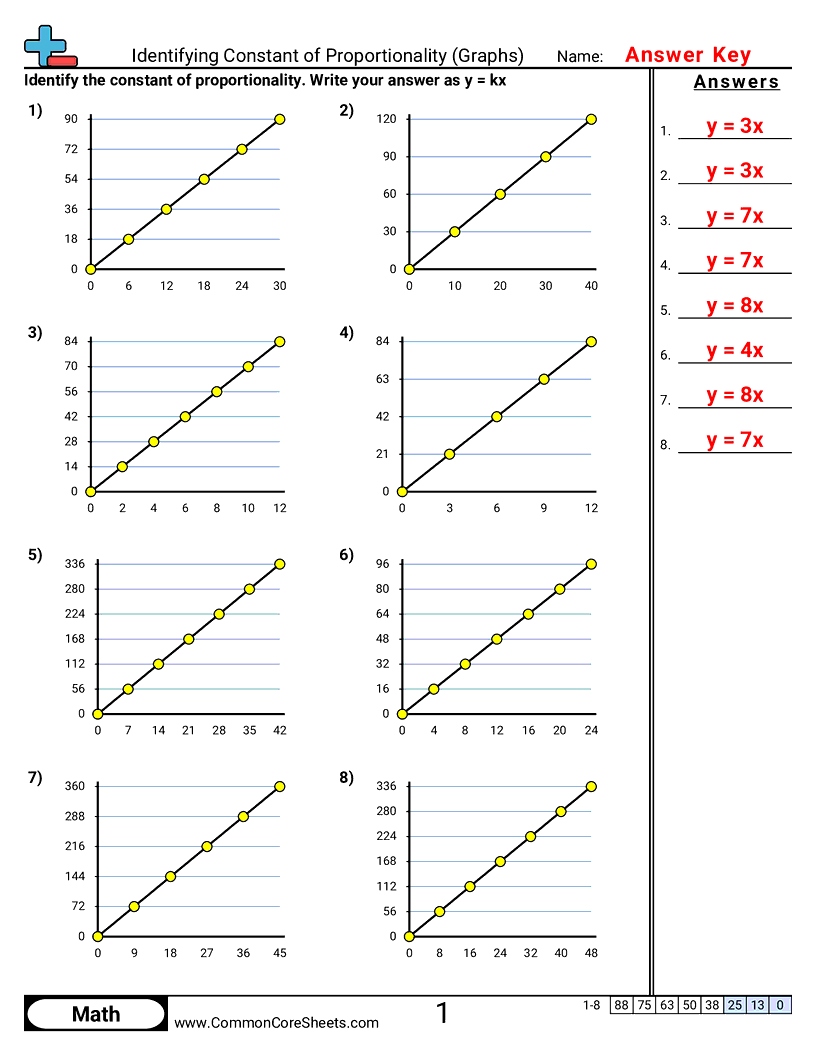
About this worksheet
Each worksheet has 8 problems using a graph to identify the constant of proportionality.
This worksheet is designed to aid in mastering the concept of identifying the Constant of Proportionality in graphs in Math. Containing 8 engaging problems, it fosters an interactive learning experience for children. Notably, this adaptable worksheet can be customized according to individual needs, converted into flashcards for enhanced learning, or seamlessly incorporated into distance learning programs.
Student objectives
- Find the constant of proportionality (k) from a graph by comparing y to x.
Everyday practice
- Use a distance-time graph to tell how fast someone is moving at a steady speed.
- Use a cost graph (like dollars vs pounds of fruit) to find the price per pound.
- Use a recipe scaling chart to figure out how much of an ingredient you need per serving.
- Use a phone data graph (gigabytes vs days) to find the average data used per day.