Comparing Rate of Change
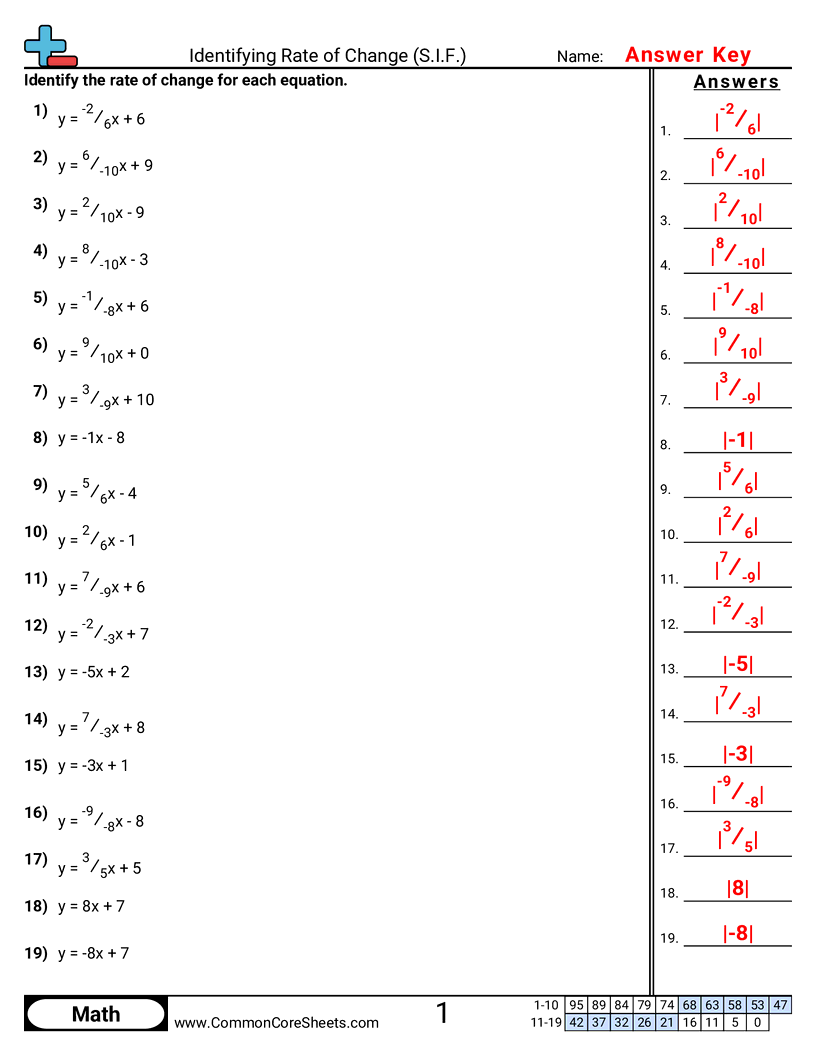
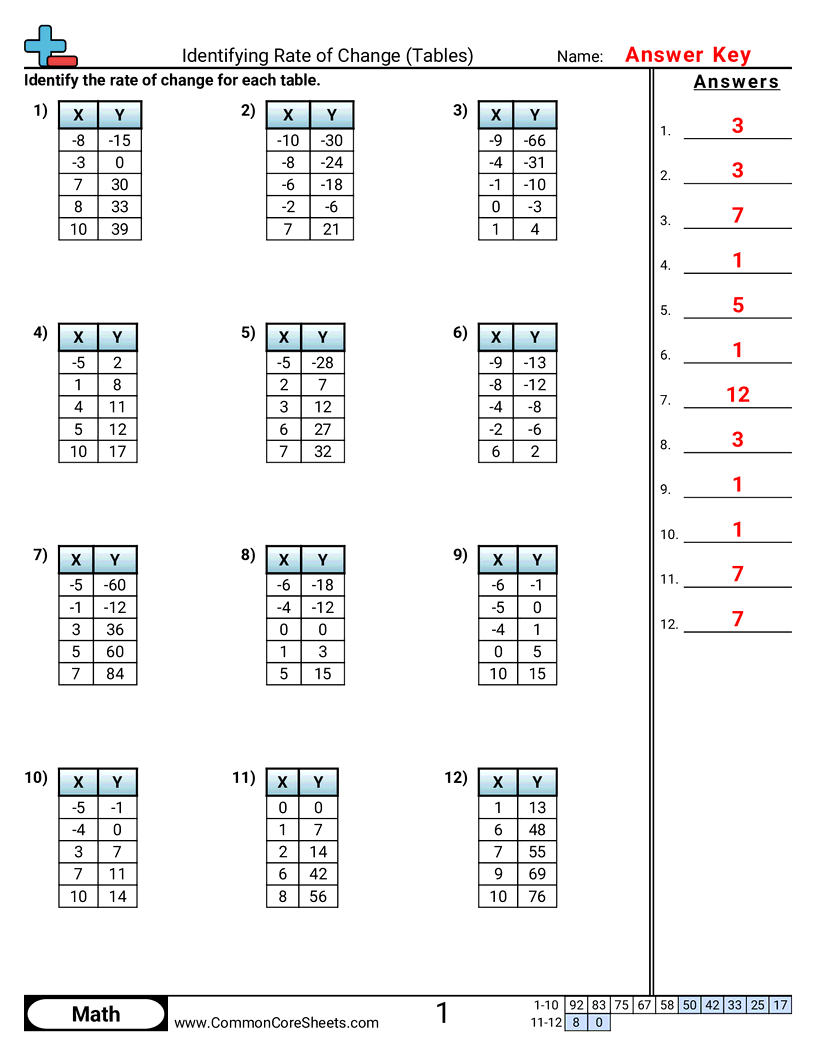
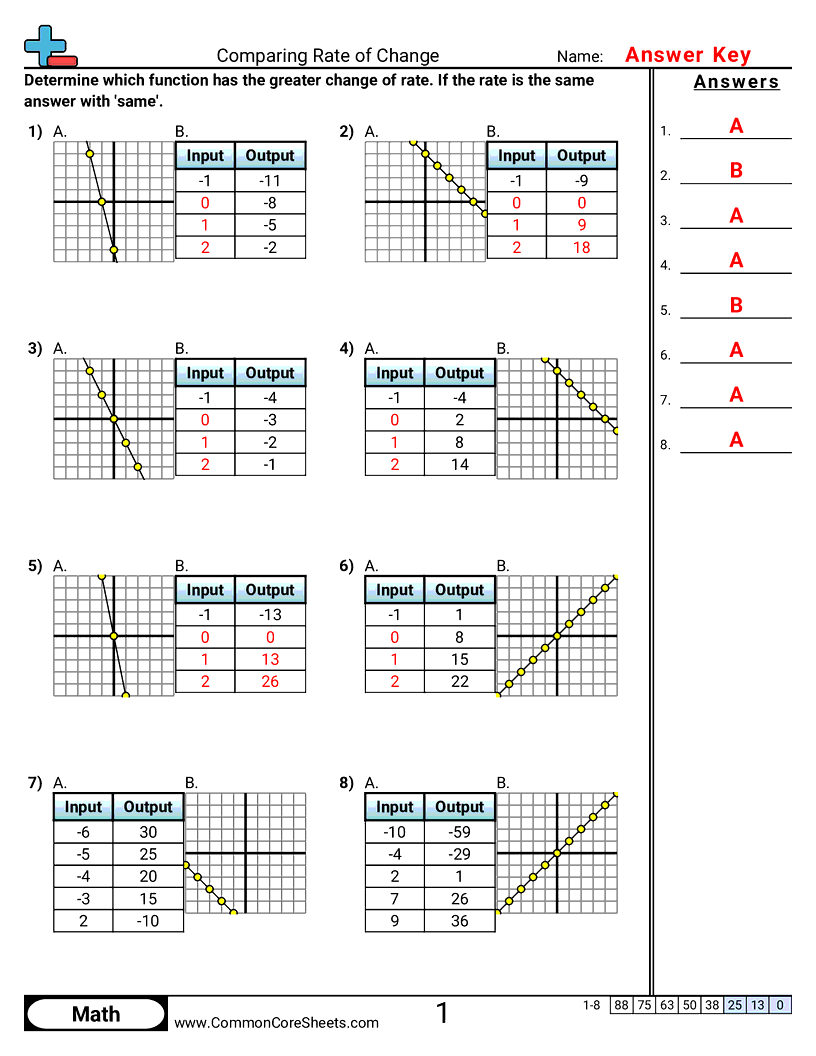
Each worksheet has 8 problems comparing the rate of change between graphs, tables and equations.
Student Objectives
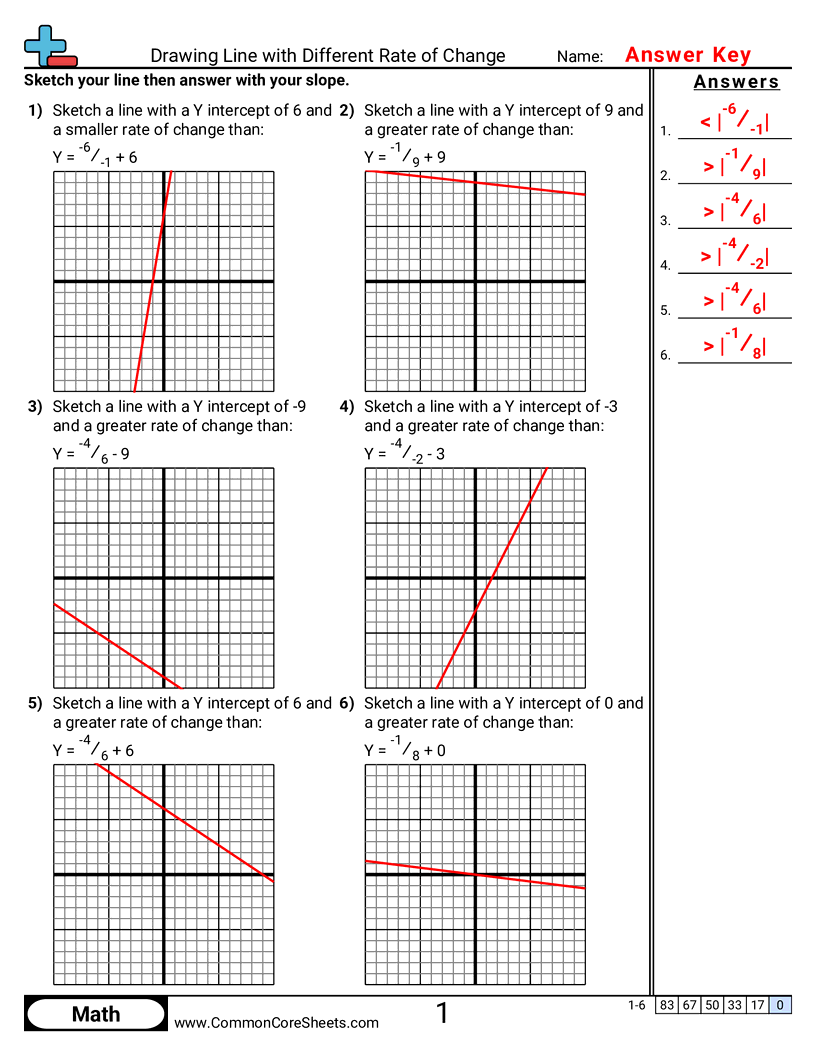
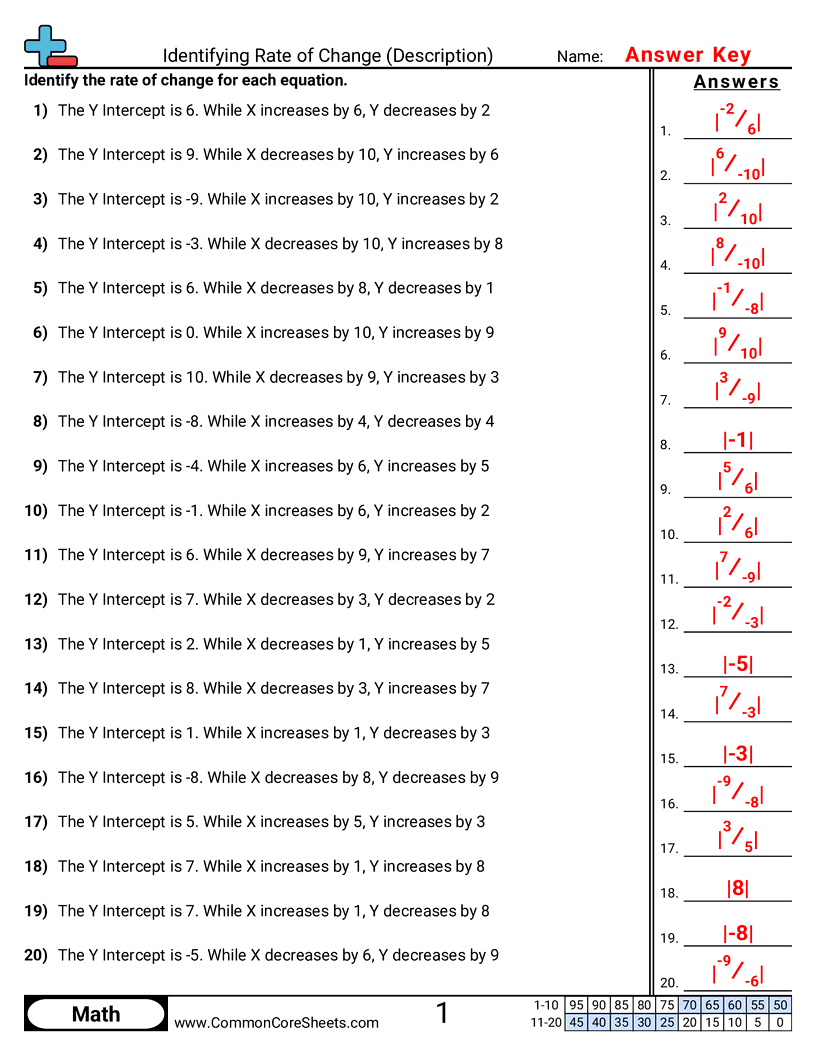
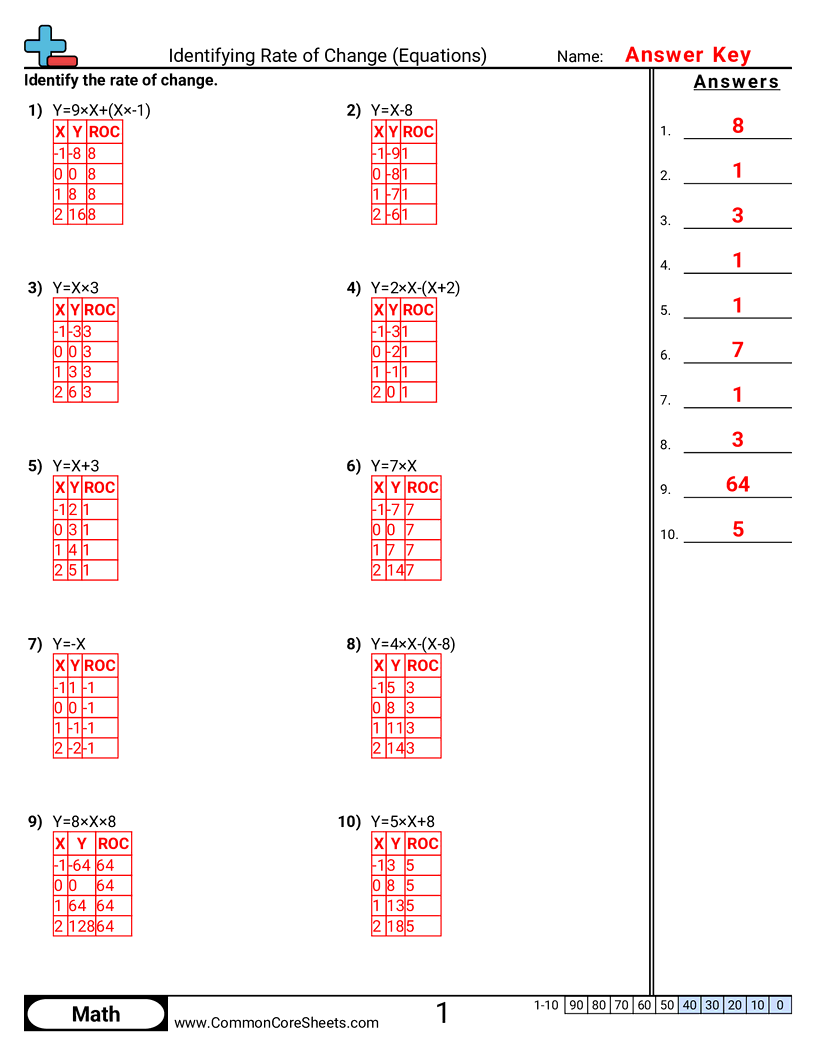
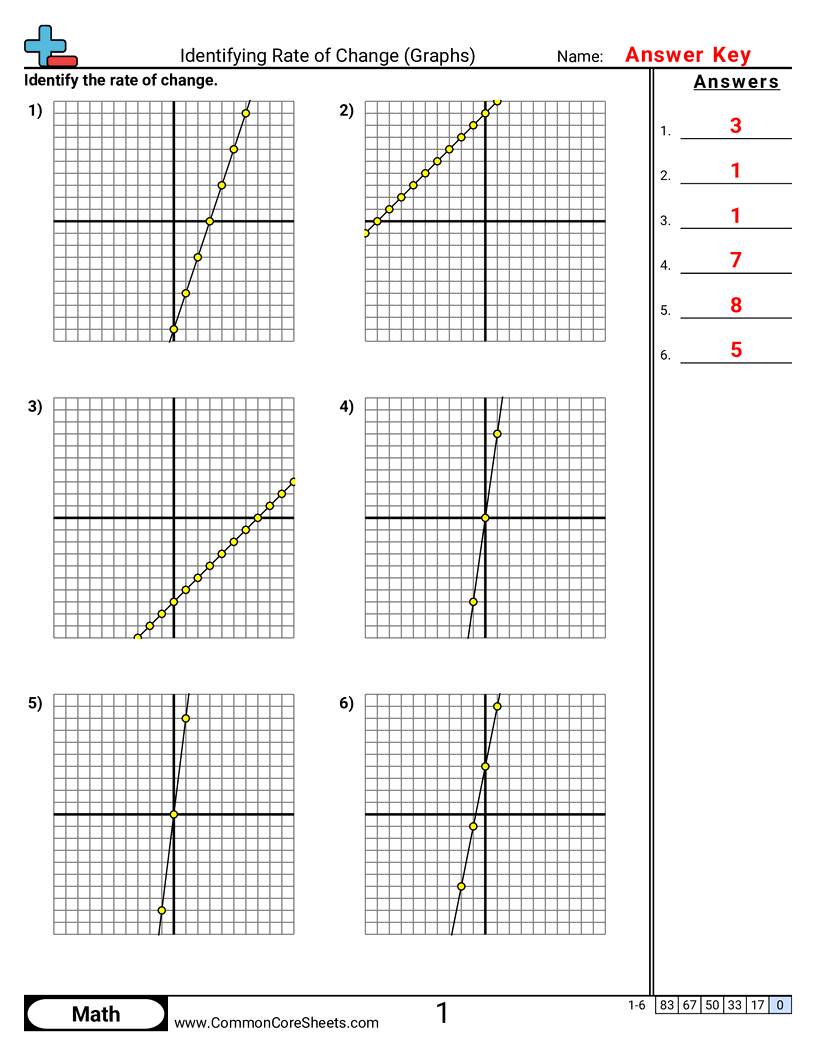
- Compare the rate of change of a function shown as a graph versus one shown as a table
- Determine which function has the greater rate of change
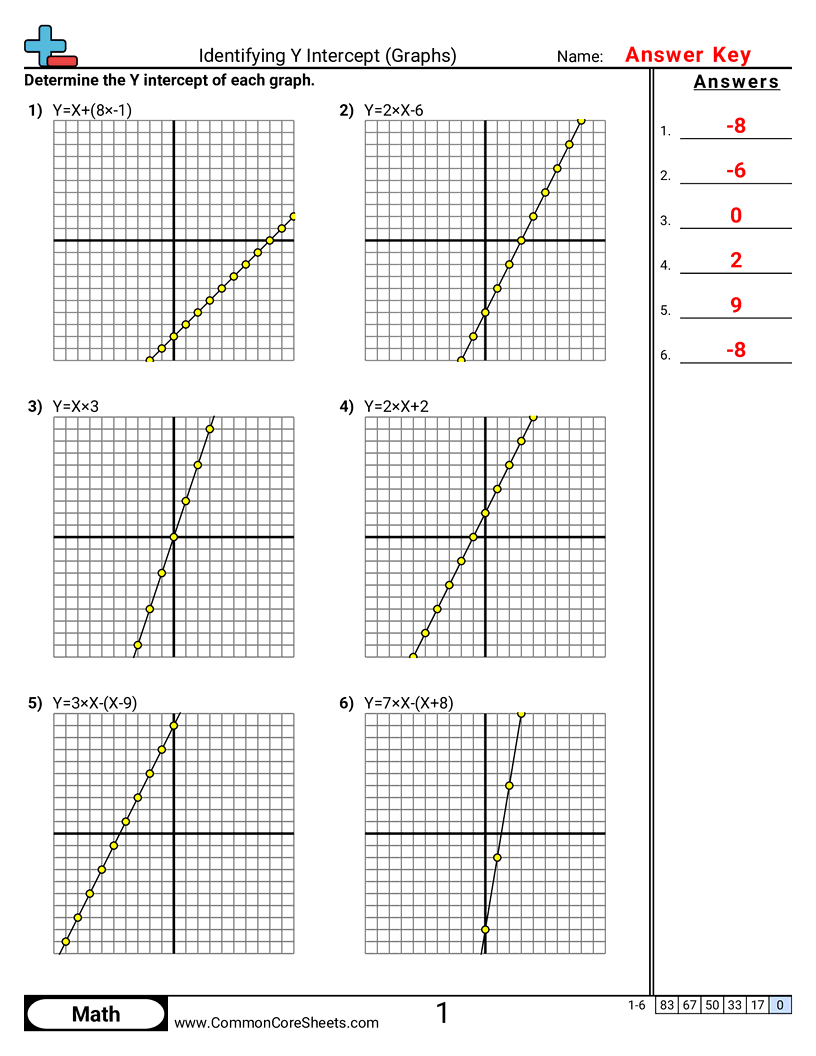
- Find the slope from a graph by reading the rise and run between plotted points
Tags
Standards