Reading a Bar Graph: 4 Bars - Single Unit Worksheet Download
Free 2nd Grade (2md10) math worksheets on Reading a Bar Graph . Each worksheet has 10 problems with an answer key and are ideal for teachers and homeschooling. You can download the PDF, create a set of flash cards or set it up for online learning.
Select a Different Activity
>


Sheet Information >
About this worksheet
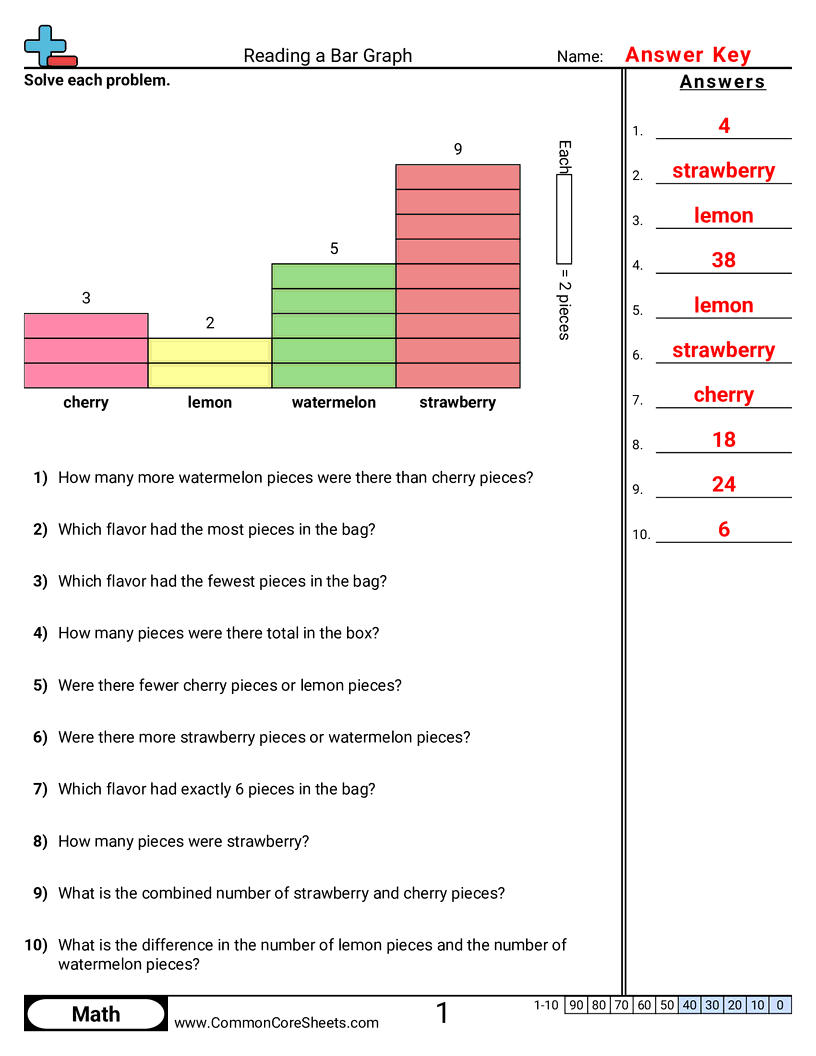
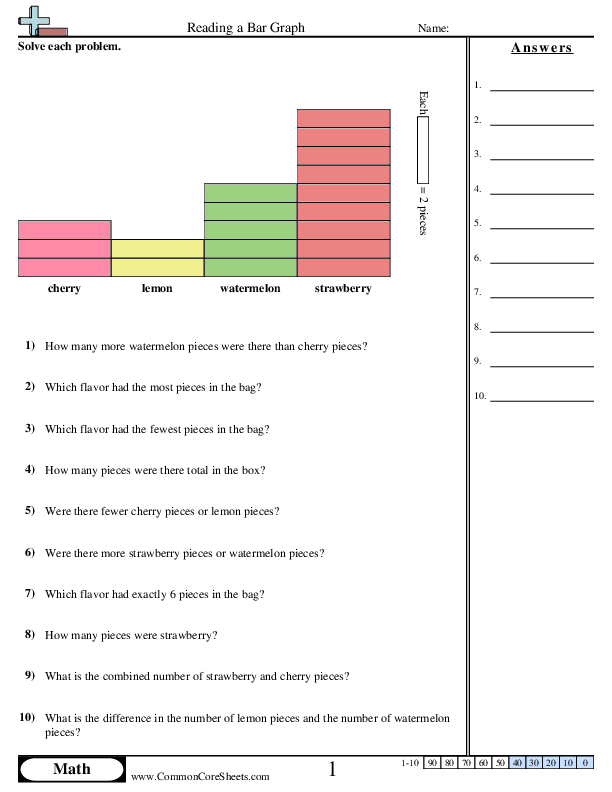
Each worksheet has 10 questions answering questions based on a bar graph.
This worksheet is designed to enhance children's mathematical skills specifically in reading and interpreting bar graphs. Featuring 10 problems, it presents questions about point comparisons among teams, highest and lowest scores. The customizable content can easily be converted into flash cards for interactive learning or utilized in distance learning settings, fostering independent comprehension of this critical aspect of math education.
Student objectives
- Read a bar graph with four categories and understand what each bar stands for.
- Use the scale on the graph to find the value for each bar.
- Answer questions that compare two categories, like which has more or less and by how much.
- Add or subtract values from the graph to answer questions about totals and differences.
- Use the graph to find the highest and lowest categories.
Everyday practice
- Look at a simple chart of favorite snacks in a class and compare which snack got the most votes.
- Read a sports stats graphic to see which player scored more points and how many more.
- Check a weekly chore chart that tracks how many jobs each person did and compare totals.
- Use a reading log chart to see which day had the most pages read and how many more than another day.