Home
Favorites
My Account
Menu
Common Core Sheets
Math
Spelling
Create-A-Review
Create-A-Test
Create-A-Sheet
improving a paragraph
login
x
reading
>
Daily Reading Comprehension
New
comprehension - insects
comprehension - arachnids
comprehension - reptiles
comprehension - mammals
comprehension - birds
Teacher Panel
>
My Account
Distance Learning Assignments
My Classes
Grade Book
Grade Scale
My Created Sheets
Site Options
Spelling
>
Spelling Worksheets Maker
Spelling List Generator
New
User Spelling Lists
Math
>
Daily Reviews Creator
Create-A-Test
Create-A-Flash Card
Sort By Grade
Addition
Subtraction
Multiplication
Division
Algebra
Angles
Area & Perimeter
Balancing Equations
Bar Graphs
Box Plots
Capacity
Cheat Sheets
Converting Forms
Counting
Decimals
Division
Drills
Fact Families
Factors
Fractions
Grids
Lines
Line Graphs
Line Plots
Mean, Median, Mode & Range
Measurement
Money
Multiplication
Multistep Problems
Negative Numbers
Order of Operations
Patterns & Function Machines
Percent
Pictographs
Pie Graphs
Probability
Properties
Ratios
Rounding
Shapes
Statistics
Subtraction
Tally
Tape Diagrams
Temperature
Time
Trigonometry
Value & Place Value
Variables
Weight
Venn Diagrams
Volume
Drills
Search Premade Sheets
social studies
>
Geography
Primary & Secondary Sources
Timelines
Create-A-Sheet
science
>
Tools
Volume
Create-A-Sheet
Language Arts
>
Improving a Paragraph
Coloring Pages
>
Easter
New
Teacher Panel
>
My Account
Distance Learning Assignments
My Classes
Grade Book
Grade Scale
My Saved Sheets
Site Options
Languages
>
spanish
german
russian
italian
vietnamese
french
english
Help Support the Site
>
Patreon
Paypal
Other Stuff
>
How to Use Worksheets
Contact & Comment
Home
Math Worksheets
Tally Worksheets
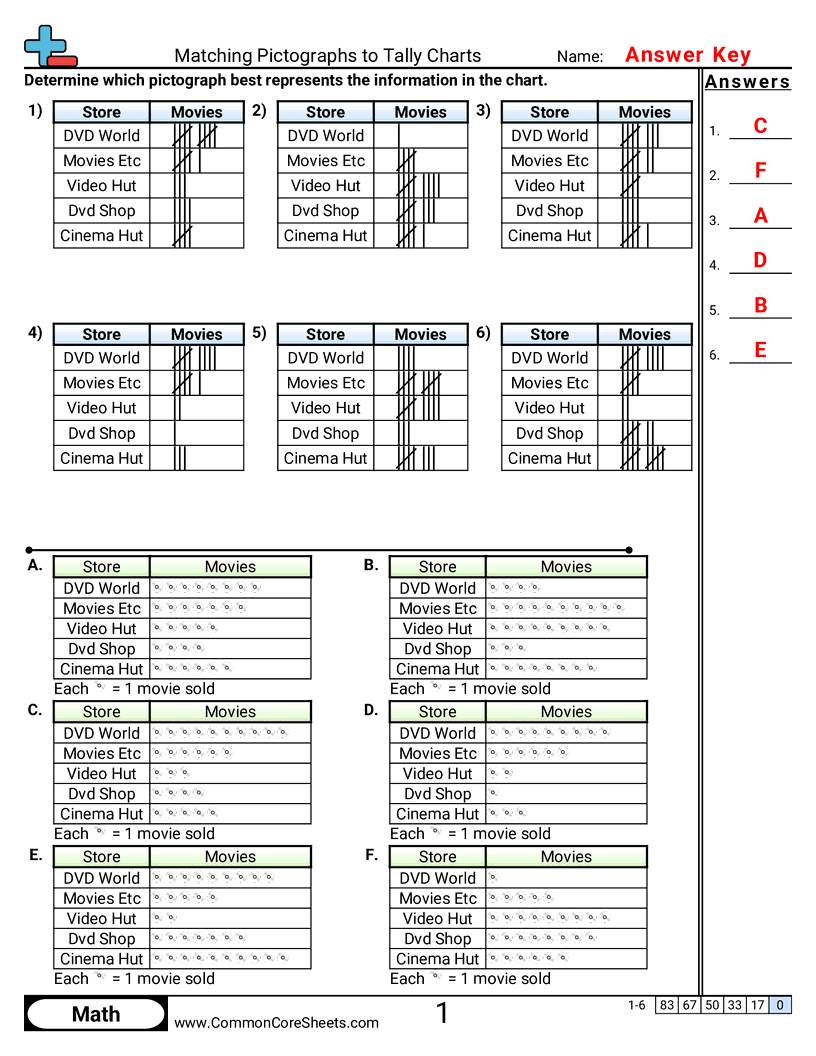
Matching Pictographs to Tally Charts
Like
Playwire Advertisement
Matching Pictographs to Tally Charts
Each worksheet has 6 problems matching a tally chart to a pictograph.
Worksheet
One Atta Time
Flash Cards
Distance Learning
Create New Sheet
Student Objectives
Read tally marks and count how many items they represent.
Read a pictograph and count the total by using the picture key.
Match two displays that show the same data even when they look different.
Compare counts to see which category has more or fewer.
Tags
numeric
visual
tables
matching answers
addition
Standards
Playwire Advertisement