Creating a Box Plot on a Number Line: Creating Box Plots Worksheet Download
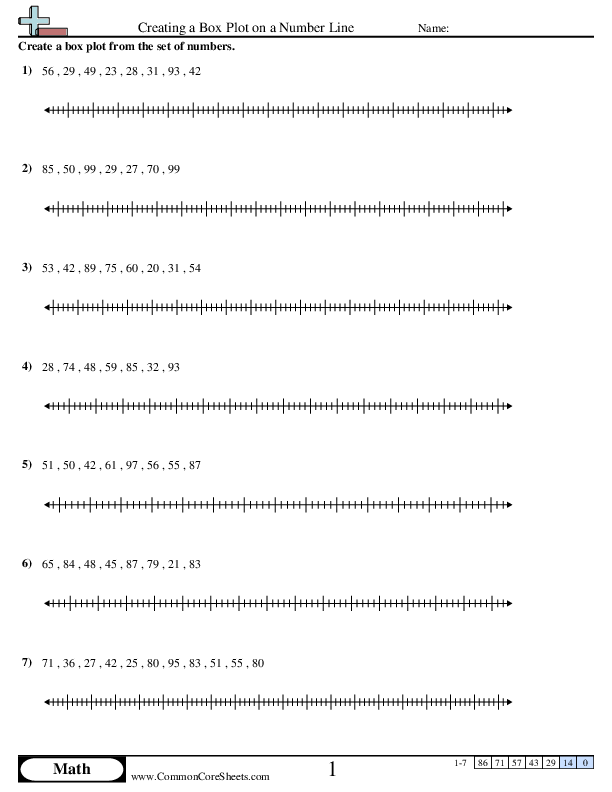
Free 6th Grade (6sp4) math worksheets on Creating a Box Plot on a Number Line. Each worksheet has 7 problems with an answer key and are ideal for teachers and homeschooling. You can download the PDF, create a set of flash cards or set it up for online learning.
Select a Different Activity
>


Sheet Information >
Creating Box Plots
Each worksheet has 7 problems creating a box plot from a set of numbers.

About this worksheet
Each worksheet has 7 problems creating a box plot from a set of numbers.
This worksheet is designed to educate children on the essentials of creating a box plot on a number line in math. It features 7 distinct problems that progressively challenge students to analyze number sets and determine their min, max, quartile values, bolstering crucial statistical literacy. Its customizable nature allows it to be converted easily into flash cards or adapted for distance learning students.
Student objectives
- Put a set of numbers in order so you can find the middle and the quartiles.
- Find the five-number summary (minimum, Q1, median, Q3, maximum) for a data set.
- Draw a box plot on a number line using the five-number summary.
- Use a box plot to describe how spread out the data is and where most values fall.
Everyday practice
- Compare how long different people took to run a mile by making a box plot of the times.
- Summarize a week of daily temperatures with a box plot to see the typical range.
- Compare video game scores from several rounds by plotting them to see the middle score and spread.
- Look at a class set of quiz scores with a box plot to see where most scores landed and how wide they were.
Standards
Tags
visualnumber line